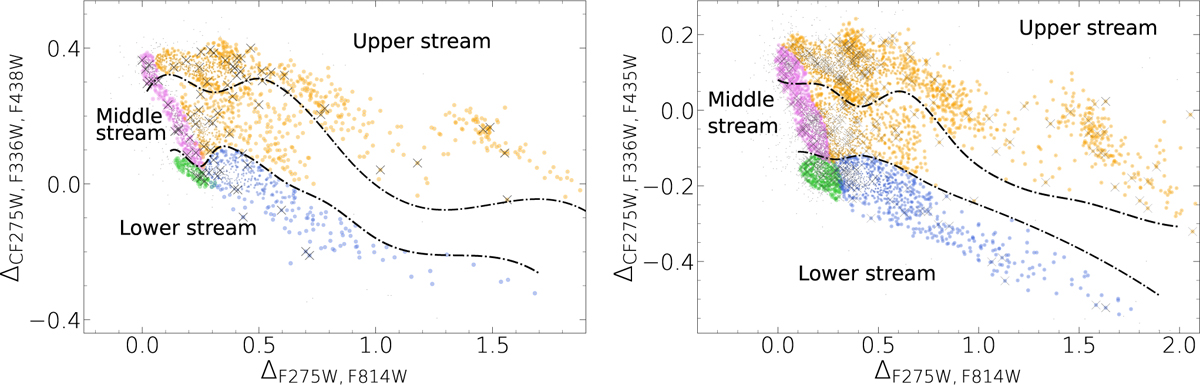
Fig. 1
Download original image
Chromosome maps (ChMs) of the innermost two arcmin of ωCen published by (Milone et al. 2017) (left panel) and of the 2–5 arcmin region constructed from the HST catalog of Häberle et al. (2024) (right panel). The 1P, 2P, AI, and AII stars are shown in green, violet, blue, and orange, respectively. The two dot-dashed black lines separate the lower, middle, and upper streams in each panel. Black crosses mark stars that are present in our spectroscopic dataset presented in Section 2.
Current usage metrics show cumulative count of Article Views (full-text article views including HTML views, PDF and ePub downloads, according to the available data) and Abstracts Views on Vision4Press platform.
Data correspond to usage on the plateform after 2015. The current usage metrics is available 48-96 hours after online publication and is updated daily on week days.
Initial download of the metrics may take a while.