Fig. 11
Download original image
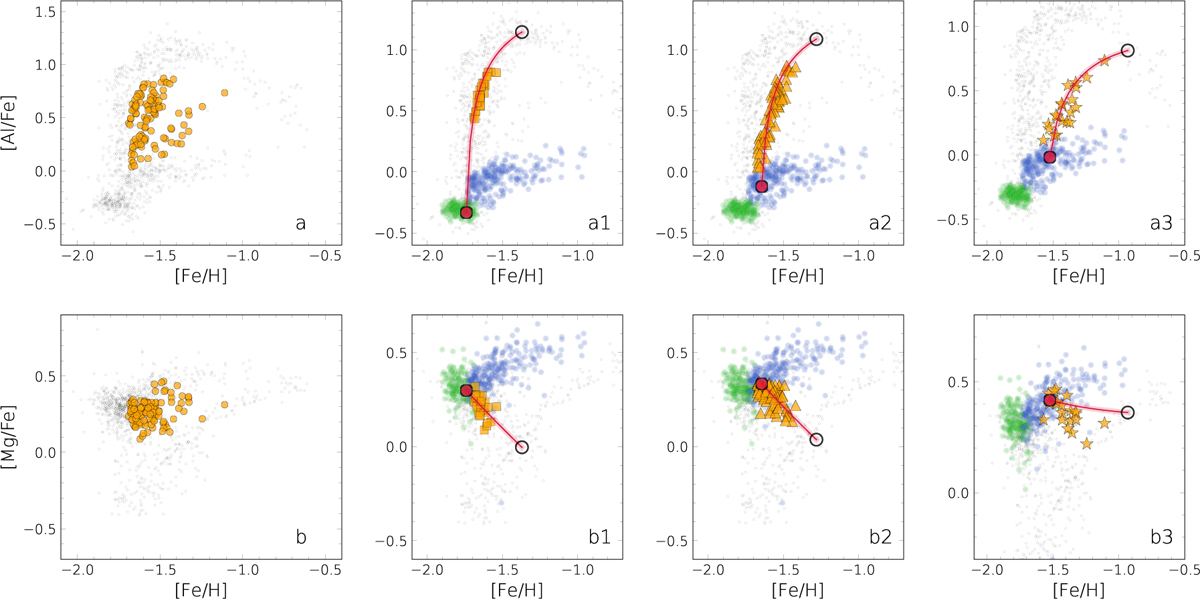
Diagram of [Al/Fe] vs. [Fe/H] showing middle-stream AII stars highlighted by orange bullets (panel a). Panels a1, a2, and a3 present the same plot zoomed in around seq1, seq2, and seq3, respectively (see text), with lower-stream stars highlighted for reference. The best-fit fiducial lines are shown in red, with open and filled red symbols representing the 0% and 100% dilution points, respectively. Panels b, b1, b2, and b3, show the corresponding plots in the [Mg/Fe] vs. [Fe/H] plane.
Current usage metrics show cumulative count of Article Views (full-text article views including HTML views, PDF and ePub downloads, according to the available data) and Abstracts Views on Vision4Press platform.
Data correspond to usage on the plateform after 2015. The current usage metrics is available 48-96 hours after online publication and is updated daily on week days.
Initial download of the metrics may take a while.