Fig. 2
Download original image
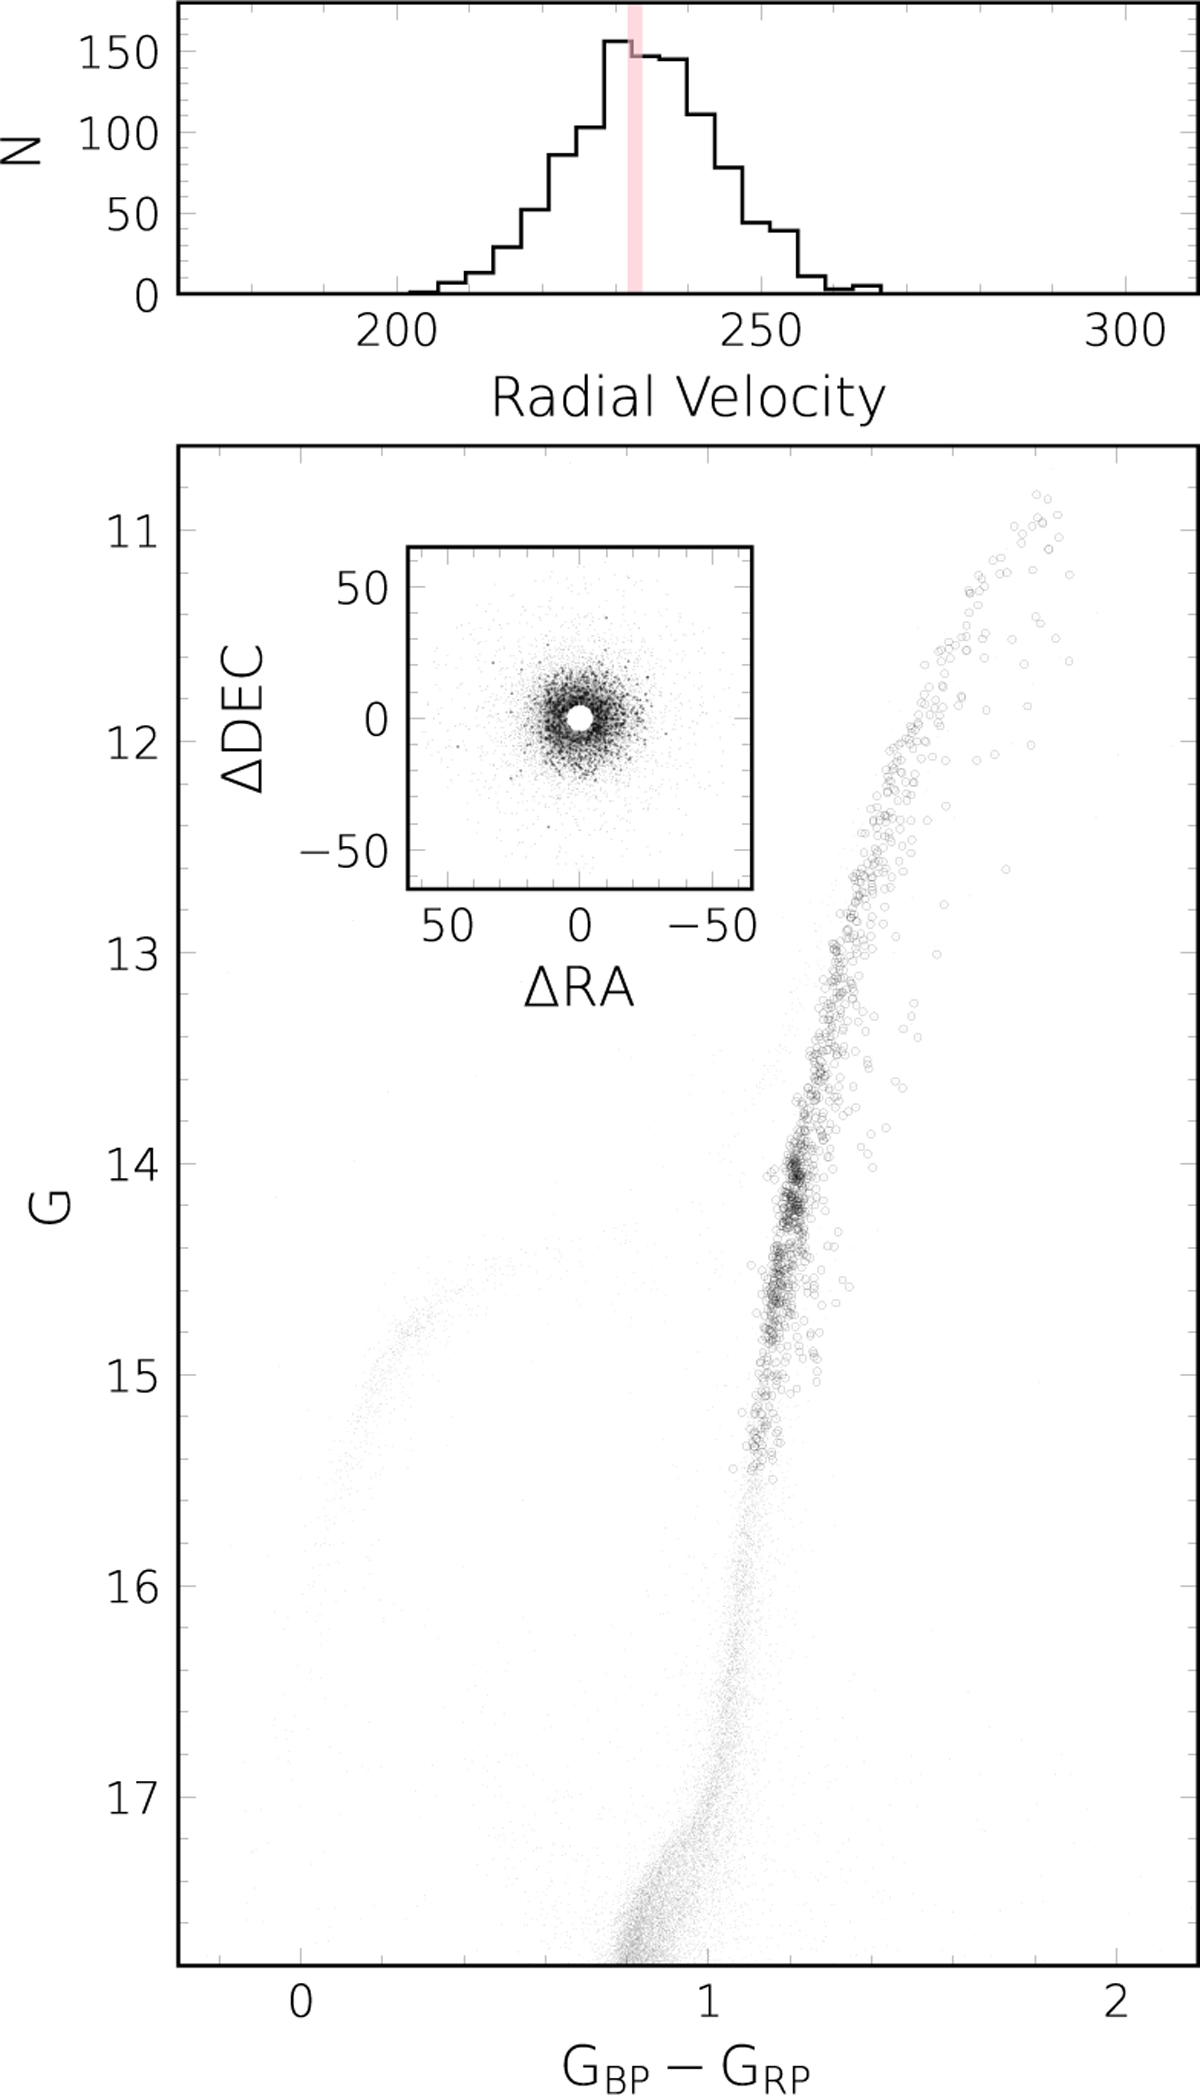
Color–magnitude and radial-velocity diagrams of G vs. GBP-GRP from Gaia photometry. Gray points represent ωCen members with high-quality photometry, while black dots indicate the RGB stars with available APOGEE abundances, who reach up to ~30 arcmin radius. The inset shows the ΔDEC vs. ΔRA position respect to the cluster center (in arcmin) of the stars shown in the CMD. The top panel displays the radial velocity histogram of the selected sample of stars.
Current usage metrics show cumulative count of Article Views (full-text article views including HTML views, PDF and ePub downloads, according to the available data) and Abstracts Views on Vision4Press platform.
Data correspond to usage on the plateform after 2015. The current usage metrics is available 48-96 hours after online publication and is updated daily on week days.
Initial download of the metrics may take a while.