Fig. 3
Download original image
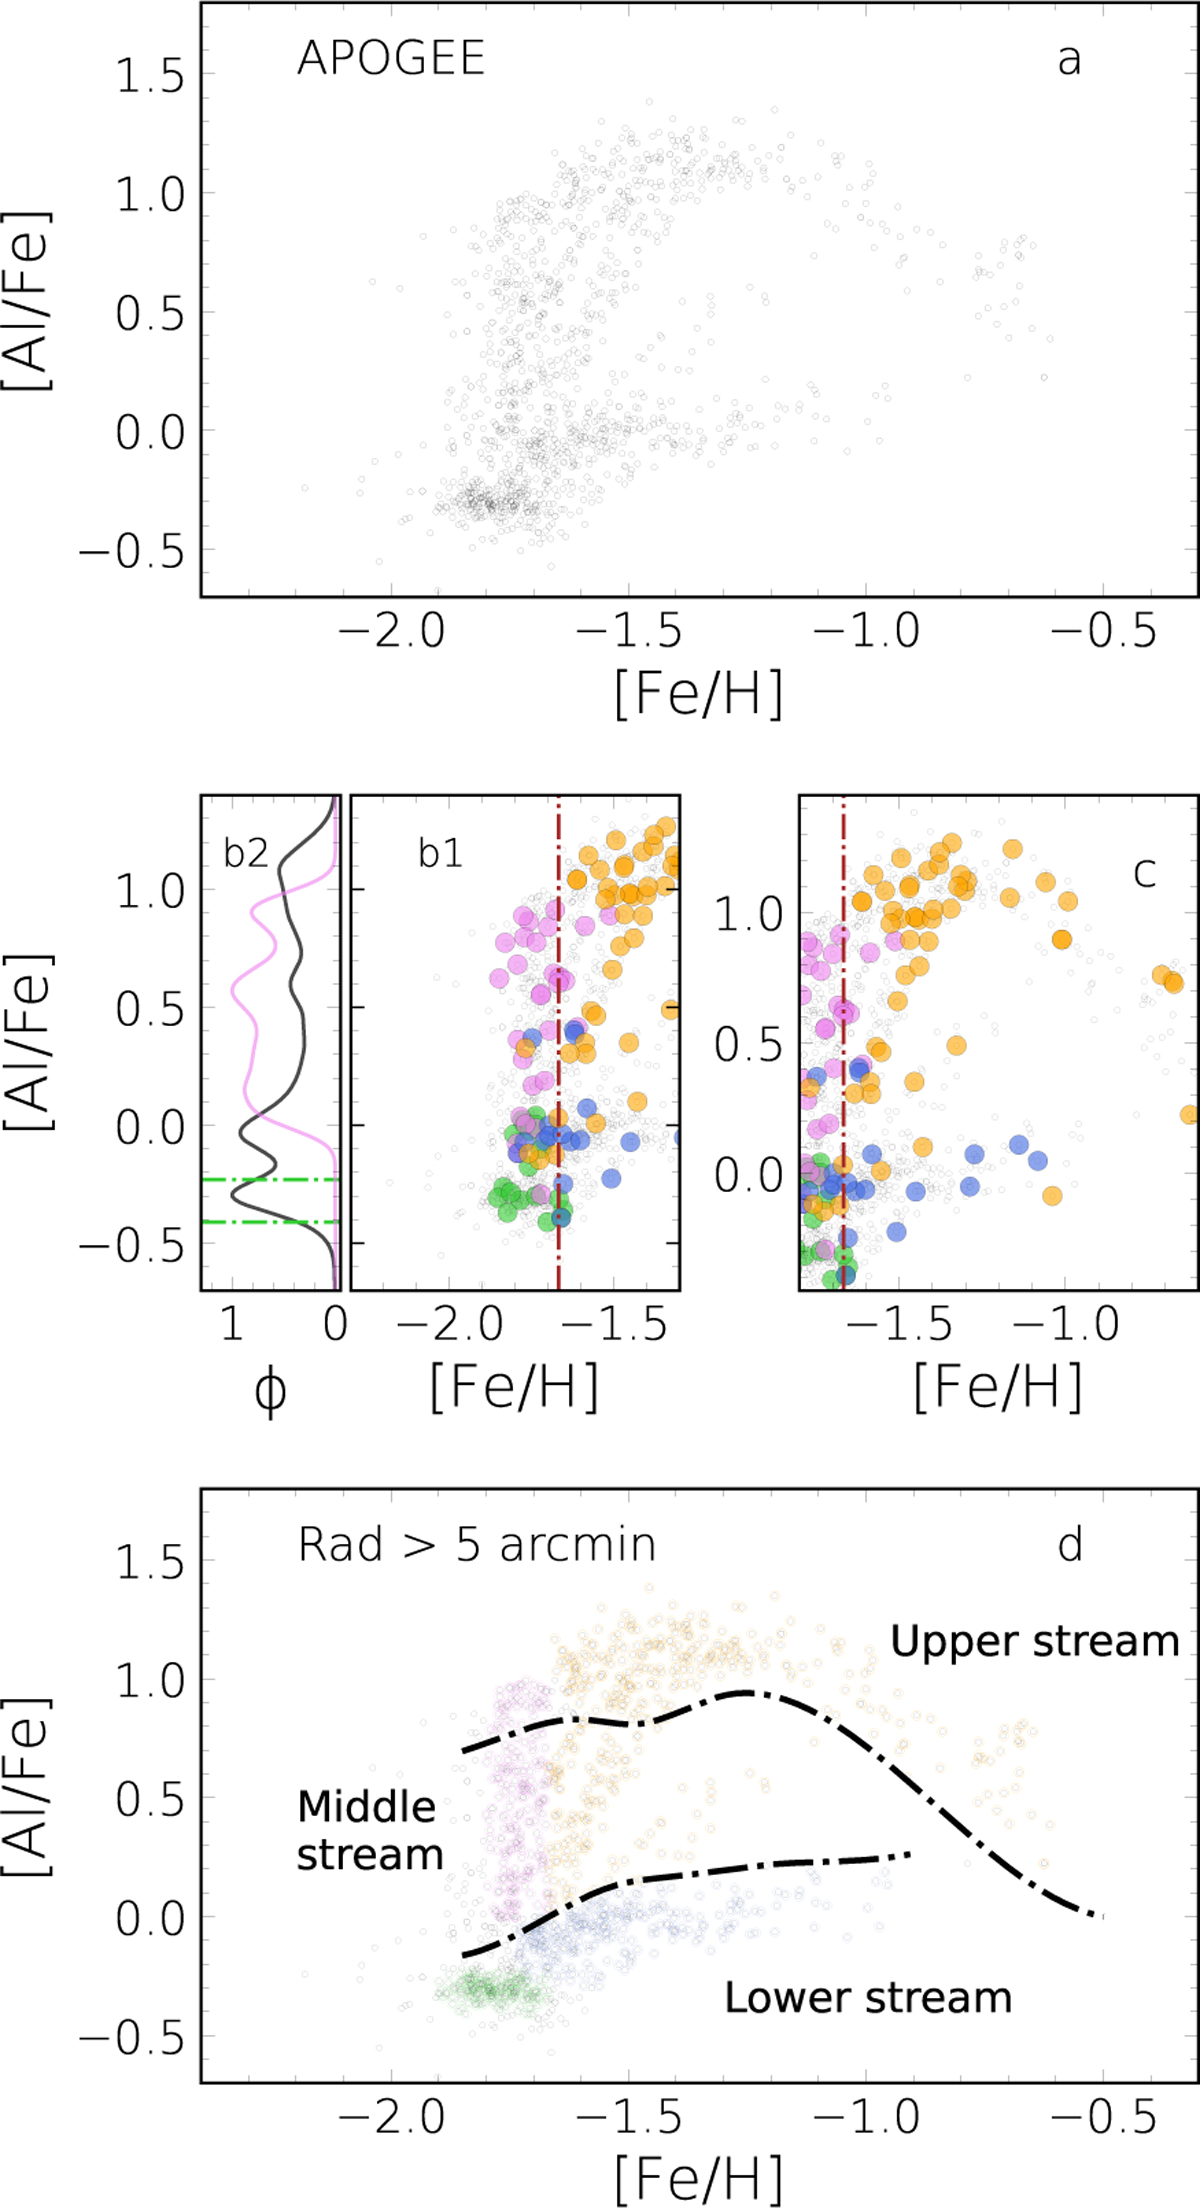
Panel a: diagram of APOGEE [Al/Fe] vs. [Fe/H] for RGB stars in ωCen. Panel b1: zoom-in on the iron-poor end. Stars with ChM tagging are colored according to their assigned population, while the vertical dot-dashed line marks the 90th percentile of the 1P-star [Fe/H] distribution. Panel b2: normalized kernel-density distribution of [Al/Fe] for all stars (black) and for 2P stars (violet). The two dot-dashed horizontal green lines indicate the [Al/Fe] range of 1P stars. Panel c: same as panel b1 but zoomed on higher [Fe/H]. Panel d: [Al/Fe] vs. [Fe/H] For APOGEE stars located beyond 5 arcmin, colored according to the population tagging described in Section 3.2. The black lines mark the boundaries between the three streams, as reported in the plot.
Current usage metrics show cumulative count of Article Views (full-text article views including HTML views, PDF and ePub downloads, according to the available data) and Abstracts Views on Vision4Press platform.
Data correspond to usage on the plateform after 2015. The current usage metrics is available 48-96 hours after online publication and is updated daily on week days.
Initial download of the metrics may take a while.