Fig. 5
Download original image
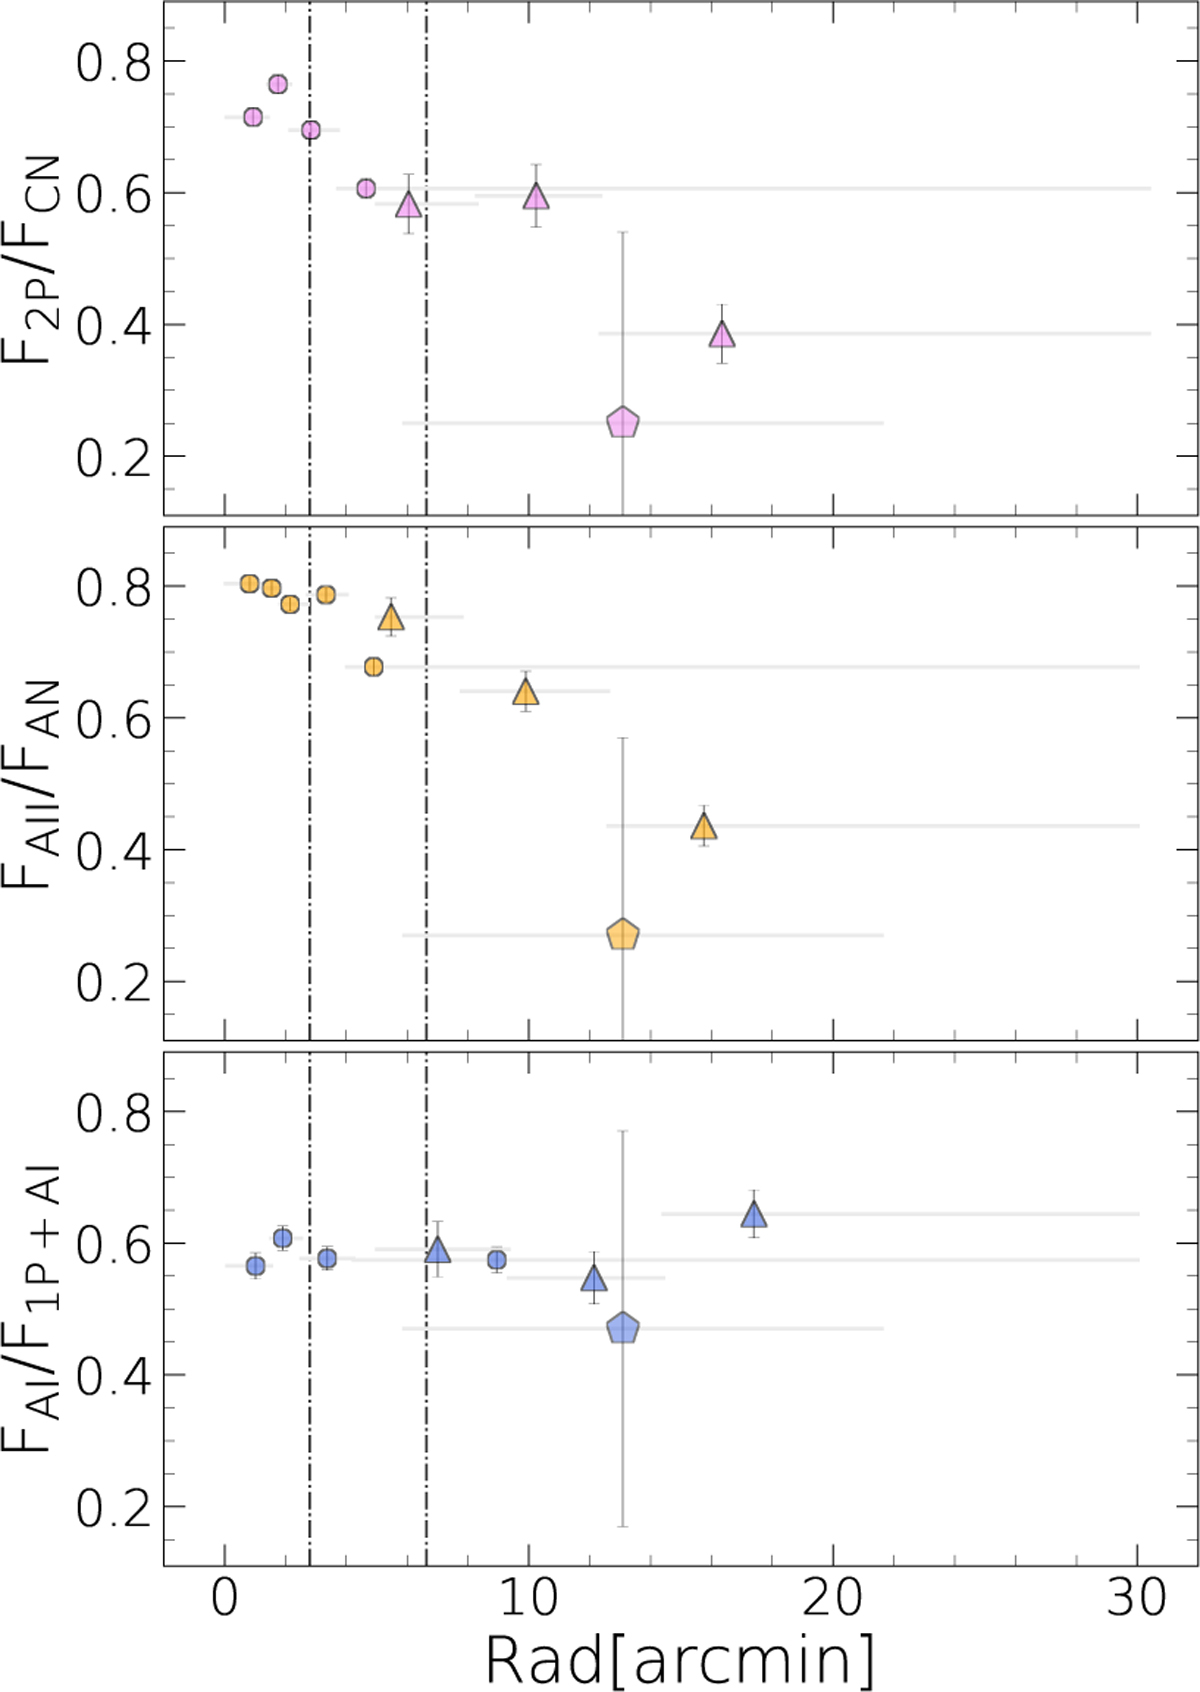
Fraction of 2P stars relative to the total amount of canonical stars (top), AII stars relative to the bulk of anomalous (middle), and AI stars relative to the entire lower stream (bottom) plotted against the radial distance from the center of ωCen. Circles indicate fractions derived from the combined dataset, while triangles denote the APOGEE dataset only (see text for details). Diamonds represent fractions from binaries stars only. Gray lines show the radial intervals relative to each measurement, while the dot-dashed black lines mark the core and half-mass radii.
Current usage metrics show cumulative count of Article Views (full-text article views including HTML views, PDF and ePub downloads, according to the available data) and Abstracts Views on Vision4Press platform.
Data correspond to usage on the plateform after 2015. The current usage metrics is available 48-96 hours after online publication and is updated daily on week days.
Initial download of the metrics may take a while.