Fig. 2.
Download original image
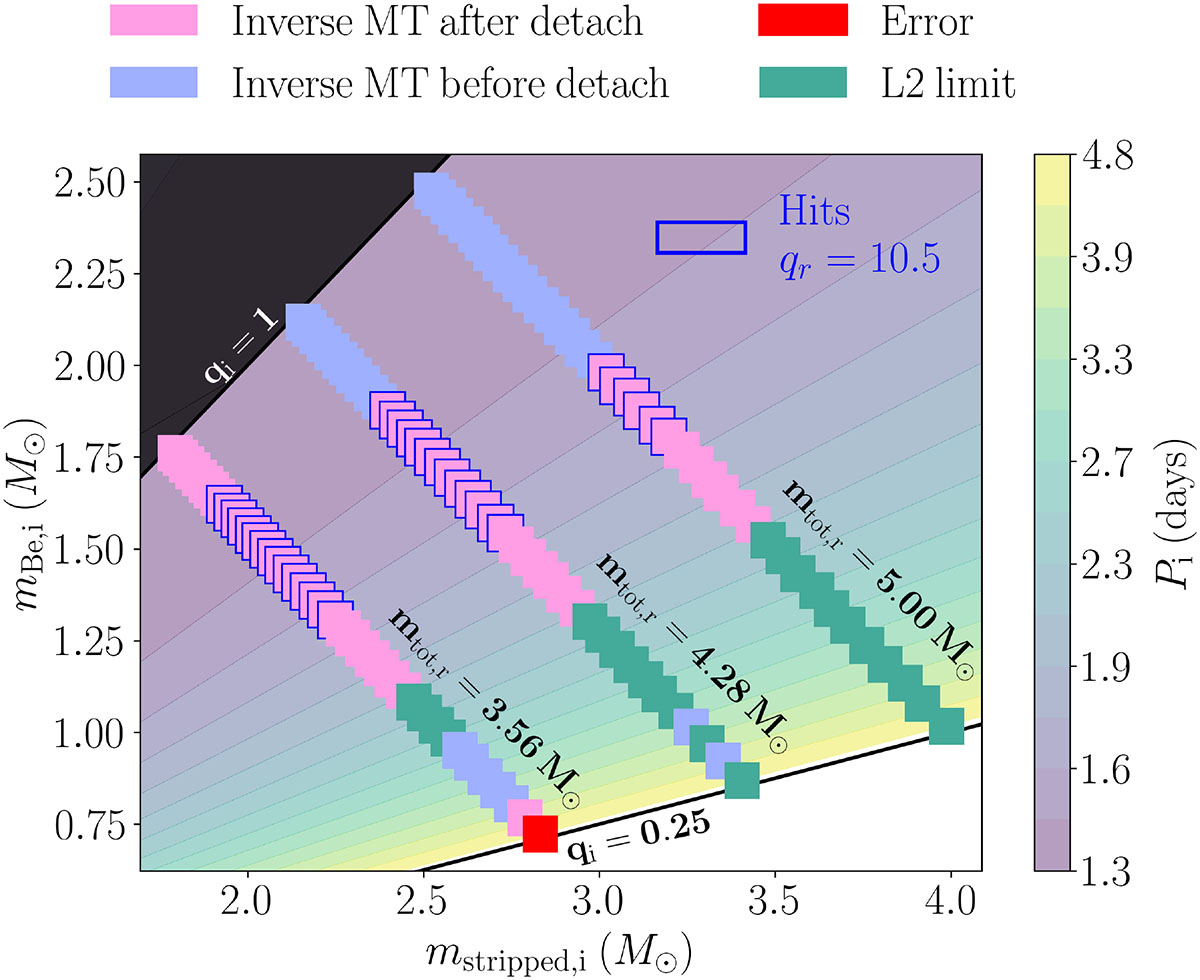
Contour levels of initial orbital periods, Pi, allowed by stable MT with ϵ = 1 efficiency, if the period at detachment is imposed to be Pr = Ptoday from Table 1 and the reference mass ratio is qr = 10.5. We populate the lines of constant total mass at the present-day with MESA simulations, represented by their outcome with color-coded pixels. If these simulations reach a mass ratio at detachment qdetach such that qdetach ≥ qr, we mark them as hits (blue edges). This is shown as a function of stripped and Be star initial masses, mstripped, i and mBe, i. The black region indicates initial mass ratios of qi > 1, and the solid black line delimiting the base of the contour plot corresponds to qi = 0.25; i.e., the lowest mass ratio we evolved.
Current usage metrics show cumulative count of Article Views (full-text article views including HTML views, PDF and ePub downloads, according to the available data) and Abstracts Views on Vision4Press platform.
Data correspond to usage on the plateform after 2015. The current usage metrics is available 48-96 hours after online publication and is updated daily on week days.
Initial download of the metrics may take a while.