| Issue |
A&A
Volume 705, January 2026
|
|
|---|---|---|
| Article Number | A225 | |
| Number of page(s) | 9 | |
| Section | Stellar structure and evolution | |
| DOI | https://doi.org/10.1051/0004-6361/202556556 | |
| Published online | 20 January 2026 | |
HR6819: a puffed-up stripped star system challenging stable mass transfer theory
1
Institute of Astronomy, KU Leuven Celestijnlaan 200D 3001 Leuven, Belgium
2
Sterrenkundig Observatorium, Universiteit Gent Krijgslaan 281 S9 B-9000 Gent, Belgium
3
Leuven Gravity Institute, KU Leuven Celestijnenlaan 200D box 2415 3001 Leuven, Belgium
4
Anton Pannekoek Institute for Astronomy, University of Amsterdam Science Park 904 1098 XH Amsterdam, The Netherlands
5
The School of Physics and Astronomy, Tel Aviv University Tel Aviv 6997801, Israel
6
European Southern Observatory Alonso de Cordova 3107 Vitacura Casilla 19001 Santiago, Chile
7
Université Paris-Saclay, Université de Paris, Sorbonne Paris Cité, CEA, CNRS, AIM 91191 Gif-sur-Yvette, France
★ Corresponding author: This email address is being protected from spambots. You need JavaScript enabled to view it.
Received:
23
July
2025
Accepted:
24
September
2025
Abstract
Context. HR6819 is the first system with a puffed-up low-mass stripped star + a classical Be star whose nature has been confirmed by optical interferometry. The system exhibits the most extreme mass ratio (15.7 ± 1.1), the lowest stripped star mass (0.270 ± 0.056 M⊙), and one of the shortest orbital periods (40.3266 ± 0.0016 days) compared to similar observed binaries. As a post mass transfer candidate, HR6819 offers a unique opportunity to test the physics of binary interaction, especially the fraction of mass accreted by the Be progenitor (the efficiency of the mass transfer) required to produce the system’s extreme mass ratio.
Aims. This work aims to reconstruct the possible evolutionary history of HR6819 in the context of stable mass transfer via Roche lobe overflow. We want to explore how the tight constraints on the system’s total mass, mass ratio and orbital period are limiting the range of possible progenitors of the system.
Methods. Based on analytical expectations for the orbital evolution, we build grids of MESA simulations designed to match the present-day orbital period and mass ratio of the system, with different mass transfer efficiencies from fully conservative to 50% efficient.
Results. We show that evolution via stable mass transfer cannot explain the combined extreme current mass ratio and tight orbital period of the system. There is a limit on how extreme the post-mass transfer mass ratio of the progenitor binary can be at a fixed detachment period, and this limit is dependent on the efficiency of the mass transfer episode: the less efficient the mass transfer episode, the less extreme the mass ratio at detachment. Even in the case of fully conservative mass transfer, the most extreme mass ratio we can produce with binary evolution simulations is q ∼ 11.5 at P ∼ 40 days, which is significantly below the observed value. We also show that the reported luminosities for each component significantly exceed the value expected from their mass. In particular, based on simple stripped star models, we find that the luminosity of the bloated stripped star requires a star with a mass of ∼0.7 M⊙, which is over twice the measured value.
Conclusions. Our work shows that the post-interaction properties of HR6819, especially its extreme mass ratio and orbital period, cannot be produced by stable mass transfer under standard assumptions.
Key words: accretion / accretion disks / binaries : close / stars: emission-line / Be / stars: evolution / subdwarfs
© The Authors 2026
 Open Access article, published by EDP Sciences, under the terms of the Creative Commons Attribution License (https://creativecommons.org/licenses/by/4.0), which permits unrestricted use, distribution, and reproduction in any medium, provided the original work is properly cited.
This article is published in open access under the Subscribe to Open model. This email address is being protected from spambots. You need JavaScript enabled to view it. to support open access publication.
1. Introduction
HR6819 (HD 167128) is the first system that has been unambiguously confirmed by optical interferometry to contain a low-mass stripped star caught in a puffed-up stage and a rapidly rotating Be companion. Initially thought to be a hierarchical triple hosting an outer Be tertiary and an inner binary with a black hole + a B-type star (Rivinius et al. 2020), it was later proposed Bodensteiner et al. (2020), El-Badry & Quataert (2021), Gies & Wang (2020)) as one of the so-called black-hole impostor systems (Bodensteiner et al. 2022). Given the reflex motion of the Be star’s emission lines with respect to the B-type star and the large mass ratio inferred from spectroscopy, they proposed that HR6819 was instead a post-mass-transfer binary with a low-mass stripped star and a Be companion. This configuration was then confirmed (Frost et al. 2022) by optical interferometry with long-baseline data taken by the Very Large Telescope Interferometer (VLTI, Haubois et al. 2022) with the GRAVITY instrument (GRAVITY Collaboration 2017) at high spectral resolution. These data clearly resolved a stripped object and the decretion disk surrounding the Be star and gave a first estimate of a mass for the system (3 − 7 M⊙). More recently, further interferometric monitoring together with existing spectroscopy has made it possible to constrain the full three-dimensional orbit (Klement et al. 2025), revealing an extreme mass ratio of mBe/mstripped = 15.7 ± 1.1.
Stripped stars are stars that have lost most of their hydrogen-rich envelope to a companion and they are a common outcome of the evolution of close binary systems (Sana et al. 2012). At low initial masses the removal of the envelope is mainly achieved through stable mass transfer (MT) via Roche lobe overflow (RLOF) (Kippenhahn & Weigert 1967) or through common envelope evolution (Paczyński 1971). Evolutionary models predict that, after the stripping, the star is a puffed-up naked helium core undergoing a contraction phase (e.g., Claeys et al. 2011). Subsequently, a long-lived phase of helium burning (10% of the stellar lifetime) is expected, during which the stripped star will appear hot and bright in the UV (Götberg et al. 2018) and challenging to observe with optical telescopes due to its much lower luminosity with respect to the companion. Due to the accretion of mass and angular momentum, the companion star is predicted to rapidly rotate, possibly producing a decretion disk aligned with the orbital plane (Rivinius et al. 2013), therefore producing a Be companion.
The stripping phenomenon in binaries can occur at any mass, but their spectral appearance will strongly depend on the stripped star’s mass and its mass-loss properties. It can produce Wolf Rayet stars (with masses of M ≳ 8 M⊙, Crowther 2007, Shenar et al. 2020), intermediate-mass stripped stars (2 M⊙ ≲ M ≲ 8 M⊙, Drout et al. 2023, Götberg et al. 2023, Ludwig et al. 2025) and OB-type subdwarfs (sdOBs, M ≲ 2 M⊙, Heber 2024), depending on the metallicity of the environment. In particular, sdOBs are thought to be sustained by core- or shell-helium burning as they transition to the white dwarfs’ (WDs) sequence, though the lowest mass subdwarfs may evolve through this stage without any support by nuclear fusion (e.g. Heber et al. 2003). They are found in orbit with WDs (Kupfer et al. 2015), main sequence (MS) stars (van Roestel et al. 2018, Vos et al. 2018, Schaffenroth et al. 2022) and Be stars. The sdOB companions to bright Be stars can be directly detected with UV spectroscopy (e.g. Wang et al. 2021) and infrared interferometry (e.g. Klement et al. 2024), a prototypical example being ϕ Per (Gies et al. 1998, Mourard et al. 2015). To date, targeted explorations have confirmed roughly two dozen Be + sdOB binaries with orbital periods of the order of months (e.g. Klement et al. 2024, Wang et al. 2023), which seems to support the stable MT formation scenario according to population synthesis studies (Han et al. 2003).
In HR6819, the stripped star is observed with a larger radius (hence, puffed-up) and a cooler effective temperature than normal helium-burning sdOBs, a stage that has been referred to as “bloated stripped star” and is possibly representative of the contraction stage prior to sdOBs. The bloated stage was traditionally expected to be short-lived (with a duration on the order of the thermal timescale of the stripped star; see, e.g. Kippenhahn & Weigert 1967, van den Heuvel 1975) and out of thermal equilibrium. However, evolutionary models have recently shown this stage to be near thermal equilibrium, and to last longer than expected (El-Badry & Quataert 2021, Dutta & Klencki 2024), possibly solving the tension with the growing number of puffed-up stripped stars observed so far. In contrast to standard sdOBs, bloated stripped stars are detectable in the optical and their surface properties closely resemble those of B-type MS stars of much higher mass, making their identification challenging. A first example was the case of LB-1, thought to host an ∼70 M⊙ black hole (Liu et al. 2019) and later proposed to hide a puffed-up stripped star with a mass of ∼1.5 M⊙ and a ∼7 M⊙ Be companion (Irrgang et al. 2020, Shenar et al. 2020). Along with HR6819 and LB-1, there are currently a handful of such low-mass bloated stripped stars + Be star candidates (NGC 1850; Saracino et al. (2022), El-Badry & Burdge 2022 and Rivinius et al. 2025), and there are a few more in the intermediate-mass range (e.g., γ Columbae, Irrgang et al. 2022, VFTS-291, Villaseñor et al. 2023). Notably, the very low-mass of the stripped star in HR6819 sits right at the lower boundary of possible sdOB masses (Zhang et al. 2009, Bauer & Kupfer 2021, Arancibia-Rojas et al. 2024).
The rapidly rotating Be companion in HR6819 is thought to be a representative of a post-MT spun-up accretor, supporting the idea that Be stars are formed more commonly in binaries (e.g. de Mink et al. 2013, Shao & Li 2014) than in single-star scenarios (Ekström et al. 2008, Granada et al. 2013, Hastings et al. 2020). However, the amount of mass that such an accretor can retain during the MT (the efficiency) is still unconstrained. The traditional view is that after mass growth of just a few percent the mass gainer would spin up to critical rotation (Packet 1981), therefore stopping the accretion. Additionally, rotationally enhanced winds can make the MT very inefficient, unless strong tides are preventing the spin up to critical (Langer et al. 2003). State-of-the-art evolutionary models usually account for tides and rotationally limited accretion, but the low MT efficiencies are challenged by the observations of sdOB + Be binaries, for which there is evidence for substantial accretion (Pols 2007, Bao et al. 2025, Lechien et al. 2025, Xu et al. 2025). An alternative explanation may be that the specific angular momentum of the accreted material is only a fraction of the respective Keplerian momentum (Paczyński 1971), but this effect has so far not been explored.
Systems such as HR6819 are of special interest, as they can be representative of the immediate post-MT stage, providing a window into a previously unprobed stage of binary evolution and the opportunity to test MT theory. Compared to the other well-characterised puffed-up stripped star + Be star systems, HR6819 exhibits the most extreme mass ratio (mBe/mstripped = 15.7 ± 1.1), the lowest stripped star mass (mstripped = 0.270 ± 0.056 M⊙) and one of the shortest orbital periods (40.3266 ± 0.0016 days), being also one of the best constrained systems in terms of errors. In this work, we used the refined constraints on the dynamical masses from combined interferometry and spectroscopy (Klement et al. 2025) to model the evolution of a progenitor of HR6819; we discuss this in Sect. 2. In Sect. 3, we show that evolution via stable MT cannot explain the combined extreme current mass ratio and tight orbital period of the system. We further discuss the generality of the problem and provide our conclusions in Sect. 4.
2. Methodology
We used version 24.03.1 of Modules for Experiments in Stellar Astrophysics (MESA, Paxton et al. 2011, 2013, 2015, 2018, 2019; Jermyn et al. 2023 to model the evolution of a progenitor binary to HR6819. A detailed description of our simulation setup is provided in Appendix A and the input files are uploaded in Zenodo1 for reproducibility.
We started our simulations from two ZAMS stars in orbit with an initial period Pi and with initial masses mstripped, i and mBe, i for HR6819’s stripped and Be star progenitors, respectively. We investigated the stable MT formation scenario, in which the initially more massive (primary) star is stripped of its envelope by a MT episode onto the initially less massive companion (secondary). We define the binary mass ratio, q, as
 (1)
(1)
We computed the MT rates with the contact scheme from Marchant et al. (2016). During the MT, the secondary accretes mass and becomes more massive than the primary, thus proceeding faster in its evolution and expanding within its own Roche lobe. When MT from the secondary onto the primary (inverse MT) is initiated, we stopped the simulation. We also singled out the simulation where the accreting star expands beyond the volume-equivalent radius at the L2 Lagrangian point (L2 limit) following Eq. (2) in Marchant et al. (2016), and excluded them from the analysis as they are assumed to become unstable.
To determine the initial conditions for our simulations, Pi, mstripped, i, and mBe, i, we considered mass and angular momentum conservation during stable MT (Soberman et al. 1997, but see also Tauris & van den Heuvel 2023). We define the efficiency, ϵ, of the MT as
 (2)
(2)
where Δmaccretor is the fraction of accreted mass when the donor transfers Δmdonor. Here, we allowed for a fraction, β, of the transferred mass to leave the system with the specific angular momentum of the accreting star (commonly referred to as isotropic re-emission). Note that β = 0 is the limit of conservative MT and β = 1 describes fully inefficient accretion. Given a certain efficiency, ϵ, mass conservation imposes the following relation between the initial total mass, mtot, i = mBe, i + mstripped, i, and the total mass at a reference point, mtot, r:
 (3)
(3)
Finally, we assumed circular orbits and constant fractions ϵ and β along the MT, and we ignored other mechanisms for angular momentum loss from the system. Our models do not include rotation, since including a rotationally limited accretion would reduce the MT efficiency and possibly mimic a very inefficient MT episode, in contrast with the observed sample of sdOBs + Be systems. For this reason, we rather wanted to explore different fixed efficiencies in order to make a statement about how conservative the MT needs to be to reproduce the orbital properties of the system. Under these assumptions, one can derive the following map between the initial orbital period, Pi, and the period at any reference point, Pr, along the MT:
 (4)
(4)
For the references qr, Pr, and mtot, r, we consider today’s values qtoday, Ptoday and mtot, today constrained by combined spectroscopy and optical interferometry (Klement et al. 2025); this is summarized in Table 1. In Fig. 1, we show the result of evaluating Eq. 4 for qr = qtoday, compared with the mass ratio as given by spectroscopy alone (Bodensteiner et al. 2020). The binary system starts the MT with a mass ratio q < 1 and, as the MT proceeds, the Be star becomes the more massive object and q > 1; i.e., the diagram follows the time from left to right. The current constraints on the mass ratio of HR6819 from the updated orbital solution limit the possible initial orbital periods to Pi ≲ 1.25 days, when the MT is assumed to be conservative. Fully non conservative MT requires even tighter initial configurations: Pi ≲ 4 h. When also considering the double-line spectroscopic binaries with a period of less than 2 d in the SB9 catalog (Pourbaix et al. 2004), we see that none of these systems could serve as the progenitor of HR6819, given the tight constraints on the present-day mass ratio from Klement et al. (2025). The possible initial configurations can be wider if one allows for a less extreme value of qr to be reached at the present-day period, Ptoday. In particular, Bodensteiner et al. (2020) modeled a progenitor system with masses of 6 M⊙ and 2 M⊙ and a period of 2 days. Their model undergoes conservative case A MT and reaches a mass ratio at detachment as high as mBe/mstripped ∼ 12.5, which falls within the uncertainty range of the mass ratio estimate from spectroscopy alone, but it is inconsistent with the tighter constraints from Klement et al. (2025).
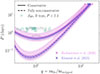 |
Fig. 1. Orbital period, P, of the binary system as a function of mass ratio q, assuming a present-day period of Pr ∼ 40 days and the two estimates of the current mass ratio from spectroscopy alone (pink; Bodensteiner et al. 2020, 15 ± 3) and combined spectroscopy and optical interferometry (purple; Klement et al. 2025, 15.7 ± 1.1), with their respective uncertainties (lighter colored bands around the respective line). HR6819 properties from these two works are also reported as scatter points, with their error bars on the mass ratio (the error bars on the period are too small to be visible). MT is assumed to be either fully conservative (solid) with ϵ = 1 or fully non conservative (dashed) with β = 1. Circles represent a selection of detached and semidetached systems from the SB9 catalogue, as in Figure 15 from Bodensteiner et al. (2020); see also their Appendix D. |
Properties of HR6819.
At fixed efficiencies, ϵ and β, Eq. (4) and Eq. (3) combined give us the possible initial values for our simulations. However, fixing qr = qtoday and Pr = Ptoday does not guarantee that the binary simulation will reach the target mass ratio, as the system can detach before or after reaching qtoday, or the MT might become unstable. As we show in Sect. 3, if we fix both Pr = Ptoday and qr = qtoday, we find no solution due to these factors.
Given these considerations, we produced simulations of progenitor systems exploring different MT efficiencies, ϵ, and different target mass ratios, qr, always keeping the reference period at Pr = Ptoday. Figure 2 showcases our determination of Pi, mstripped, i, and mBe, i for one of our grids. In this example, we show the results of fixing qr to 10.5 as an illustration. We computed Pi from Eq. (4) at 45 values of initial mass ratios (0.25 ≤ qi ≤ 0.95), such that Eq. (3) is also fulfilled if the model reaches qtoday. We did this for the median value of today’s total mass (4.28 M⊙) and repeated it for the ±2σ values, so the pixels in Fig. 2 are lining the three diagonals of constant mtot, r.
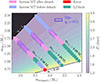 |
Fig. 2. Contour levels of initial orbital periods, Pi, allowed by stable MT with ϵ = 1 efficiency, if the period at detachment is imposed to be Pr = Ptoday from Table 1 and the reference mass ratio is qr = 10.5. We populate the lines of constant total mass at the present-day with MESA simulations, represented by their outcome with color-coded pixels. If these simulations reach a mass ratio at detachment qdetach such that qdetach ≥ qr, we mark them as hits (blue edges). This is shown as a function of stripped and Be star initial masses, mstripped, i and mBe, i. The black region indicates initial mass ratios of qi > 1, and the solid black line delimiting the base of the contour plot corresponds to qi = 0.25; i.e., the lowest mass ratio we evolved. |
3. Results
The example grid in Fig. 2 shows several possible outcomes. We find that the smaller the initial mass ratio, the easier it is for the primary to overflow beyond L2 and break the stable MT scenario; furthermore, the tighter the initial orbital period and the closer the mass ratio to unity, the easier it is for the binary to initiate inverse MT from the secondary onto the primary. If inverse MT happens before detachment, the secondary overfills its own Roche lobe before the primary can be stripped of its envelope. Therefore, the system is expected to undergo a contact phase, and we do not consider it in the analysis, as such systems typically evolve into a merger (see e.g., Fabry et al. 2025). In case where inverse MT happens after successful detachment, the primary is a stripped star when the secondary overfills its own Roche lobe. By construction, these systems will evolve during the MT along a similar curve to that in Fig. 1. If the mass ratio at detachment, qdetach, is such that qdetach ≥ qr, the stable MT episode has succeeded in producing a stripped star in a system with a mass ratio as high as qr at Ptoday. Depending on their mass ratio at the onset of the inverse MT, such systems may undergo a merger leading to a more massive stripped star, similarly to the scenario proposed for the quasi-Wolf Rayet star HD 45166 (Shenar et al. 2023).
We first produced a grid similar to that in Fig. 2, with initial conditions determined by qr = qtoday from Table 1 and MT efficiencies of 0.50 ≤ ϵ ≤ 1.00, spaced by Δϵ = 0.05 (we did not consider ϵ values lower than 0.5 for computational reasons). We found no solution for the median of the present-day mass ratio qr = 15.7, as anticipated from Fig. 1; to produce HR6819’s extreme mass ratio with stable MT, very tight initial orbital configurations are required, and all simulations experienced either L2 overflow or inverse MT before forming a stripped star. Similarly, no solutions were found for the −2σ or −3σ values of qr = 13.5 or 12.4, respectively.
Since we found no progenitor system that can reach HR6819’s extreme mass ratio at the present-day period, we investigated how extreme the mass ratio qdetach can become via stable MT, and the dependence of this limit on the conservativeness of the MT episode. For this purpose, we explored lower values for the target mass ratio qr. We produced several grids similar to those of Fig. 2, with 9.0 ≤ qr ≤ 12.0 and spaced by Δqr = 0.5. The results of the exploration are summarized in Fig. 3. We show that to form a system with a more extreme mass ratio at period, Ptoday, one needs a more conservative stable MT episode. In particular, we find that the most extreme mass ratio that can be produced consistently with the present-day period Ptoday is qr ∼ 11.5 (with a small dependence on the total mass of the system). This mass ratio is well below the 3σ lower limit for HR6819 given in Table 1.
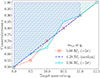 |
Fig. 3. Summary plot of our grid exploration for different degrees of conservativeness, ϵ, and different target mass ratios, qr. The area is filled where at least a solution with qdetach ≥ qr is found, for three different values of the present-day total massx, mtot, r: median (violet, with circular hatching); −2σ value (cyan, with shading); +2σ (salmon, with diagonal hatching). The scatter points along the respective lines indicate where the minimum value of ϵ that gives a solution is found. |
Figure 4 presents a selection of our results for the detachment mass ratio at mtot, r = 4.28 M⊙. For each initial mass ratio, we show the value of qdetach for systems that undergo inverse MT after successful detachment and stripping of the primary. The three panels show that increasing the target qr makes it harder for the stable MT episode to fully strip the primary before inverse MT, due to tighter initial orbital configurations. Given the dependence of the initial period on the target mass ratio, the type of MT we expect (case AB or case B) is also influenced. Lastly, the systems that undergo detachment with qdetach > qr, have, by construction, a longer detachment orbital period than Ptoday, as dictated by Eq. 4. These systems show that stable MT can produce detachment mass ratios as high as mBe/mstripped ∼ 13. These systems would have a period of P ∼ 90 days, which is comparable with the observed sample of Be + sdOB binaries, but not compatible with HR6819’s present-day period.
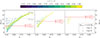 |
Fig. 4. Detachment mass ratio as function of initial mass ratio for a selection of our results. The three panels refer to three different grids for target mass ratio qr as indicated by the dashed red line, which also corresponds to a detachment period of Pr = Ptoday, by construction. Different MT efficiencies are color-coded according to the color bar, and the scatter points mark case A (x marker) and case B (triangle marker) MT. The systems have total mass mtot, r = 4.28 M⊙ (median for HR6819) at qr. In the first panel, we also show the detachment ratios corresponding to periods of 60 and 90 days in gray, as a reference. |
4. Discussion and conclusions
We calculated the evolution via stable MT of progenitors of stripped star systems and showed that it is not possible to produce mass ratios as extreme as the one measured for HR6819 from combined spectroscopy and interferometry. The initial orbital configurations of possible progenitors of HR6819 are too tight and would engage in a) MT from the secondary onto the primary before the complete stripping of the primary; b) L2 Lagrangian point overflow, depending on their initial mass ratio. High MT efficiency allows for larger initial periods and can help to overcome such difficulties; however, there is a limit to how extreme the mass ratio can become at a fixed post-interaction orbital period. A system that has evolved through stable MT can host a stripped star and its companion in an orbit of P ∼ 40 days with a mass ratio at most as high as mBe/mstripped ∼ 11.5. Conversely, the channel can produce mass ratios as high as ∼13; i.e., possibly right at the 3σ limit of the observed value, but such a system would have a much wider orbital period (P ∼ 90 days) than that of HR6819.
Figure 5 shows an example of a binary that, after the stripping of the primary via conservative MT, detaches with a mass ratio of q ≃ 11.65 at P ≃ 41.79 days. By construction, this system has a total mass at detachment of ≃5 M⊙ (the +2σ value for HR6819’s total mass), and crosses the target mass ratio qr = 11.5 at Pr = Ptoday. The stripped star mass at detachment is ≃0.4 M⊙, and the secondary has become a ≃4.6 M⊙ star still on its MS. These masses are much too low to cross HR6819’s observed values on the HRD, despite our specific choice to match the higher 2σ limit for the total mass of the system. To alleviate this problem, one could consider non conservative MT, which would allow for even higher initial masses of the components; however, our work shows that non conservative MT requires tighter initial orbital configurations and cannot reproduce the mass ratio at the observed period.
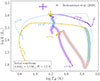 |
Fig. 5. HR diagram showing the evolution of a system composed of a primary (the stripped star progenitor) with mstripped, i = 3.3 M⊙ and a secondary (the Be star progenitor) with mBe, i = 1.7 M⊙, in orbit with an initial period of Pi = 1.5 days. The system evolves via fully conservative MT. Dots along the tracks are separated by 0.1 Myr of evolution. Purple and blue highlighted regions correspond to mass transfer on the MS (case A) and after the MS (case AB), respectively. The scatter points mark the observed locations of HR6819 according to Bodensteiner et al. (2020), with 1σ error bars. An evolutionary track for a donor star (ZAMS mass 4.6 M⊙) undergoing case B mass transfer is shown in blue as it crosses HR6819’s observable at its median. The ZAMS and stripped stars’ masses for every track are also reported along the track with corresponding colors. |
Furthermore, the present-day luminosity and effective temperature of HR6819 cannot be matched with a post-stable MT system, as both binary components would need to have a much higher ZAMS mass given the current total mass constraint. To visualize this, we produced evolutionary tracks for donor stars of different masses undergoing case B fully conservative MT and found an appropriate ZAMS mass that would explain HR6819’s stripped star( see Fig. 5). We found that our model with a ZAMS mass of ∼4.6 M⊙ would have the luminosity and effective temperature of HR6819 at the contraction stage, but with a stripped star mass as high as ∼0.7 M⊙. Such a stripped star mass is too high given the observed mstripped = 0.270 ± 0.056 M⊙ (see Table 1). We used the BONNSAI2 tool (Schneider et al. 2014) to infer the appropriate mass of the secondary given its HRD properties, after its accretion from the primary: this would need to be a  star on its MS. This is expected as the mass gainer is enriched with helium and has a higher luminosity than a single star model of similar mass.
As our results from conservative stable MT are inconsistent with HR6819’s observational constraints, one should think of possible ways to alleviate the tension. We expect convective overshooting to have an impact: a smaller core would lead to a more extreme mass ratio at detachment, as the donor star will then form a smaller helium core and, thus, a lower stripped star mass. Since we used a step-overshooting scheme of the hydrogen-burning convective core, extending its size by 0.1 pressure scale heights (see also Appendix A), we also explored a much lower value of 0.01 as a parameter variation, and present the results in Appendix B. In the case of a lowered overshooting parameter, we found that systems with mass ratios at most as high as q ∼ 12 at Ptoday can be formed via stable MT. We therefore conclude that the tension cannot be solved with a lower overshooting parameter.
Our assumption of fixed accretion efficiency throughout the MT episode might also have a significant impact on our outcomes. In HR6819, the Be star component is rotating near critically, and analytical considerations predict that during the MT episode such a critical rotation rate is reached soon after the onset of RLOF, after accreting a few percent of its mass with the specific angular momentum of its surface (Packet 1981). In this case, part of the momentum exchanged during RLOF feeds a nonzero-spin angular momentum of the accretor instead of being transferred to the orbit. At this point, the spun-up star could keep accreting mass while maintaining its rotation thanks to a braking mechanism (Deschamps et al. 2013 and references therein). Alternatively, mass may be lost from the system by feeding circumbinary outflows (e.g. Lu et al. 2023) or via localized radiation-driven winds from spots of direct-impact accretion (van Rensbergen et al. 2008). The occurrence of either of the two cases, and the subsequent degree of non conservativeness they might introduce, are major uncertainties that we did not account for in our work. As a simple estimate, we can assess the quota of spin angular momentum necessary to spin the Be star progenitor up to its critical rate and evaluate the impact of such spin-up on the final period of our models. For our models that reach a mass ratio at detachment as high as mBe/mstripped ∼ 13 with a period of P ∼ 90 days, we find that such a final period would only be reduced by ∼7%, if the Be star progenitor spun up to critical at detachment.
Other angular momentum loss mechanisms than the isotropic re-emission mode could also have an influence on our results. Fully non conservative MT via isotropic re-emission requires much tighter initial orbital configurations than the conservative case (see Fig. 1), and this makes our models experience L2 overflow or inverse MT before forming a stripped + Be star system. However, larger initial periods are allowed if material is removed from the system carrying a specific angular momentum lower than that of the accretor. We decided to explore the case in which material is expelled from the system with a fixed fraction of the specific total orbital momentum, and we recomputed our grids as described in Appendix B. Our results show that, for the same amount of mass lost from the system, stable MT with this mode of angular momentum loss can achieve a target mass ratio at Ptoday more extreme than with the isotropic re-emission mode. However, the most extreme mass ratio achievable at Ptoday with this mode is qr ∼ 11.5; therefore, it cannot explain HR6819’s properties (see Appendix B).
The total mass determination of mtot, today = 4.28 M⊙ from Klement et al. (2025) is dependent on the distance measurement. They found d = 296.0 ± 8.0 pc from dynamical parallax, which to 2σ uncertainty allows for a total mass between 3.56 ≤ mtot, today (M⊙)≤5.00, the range explored in this work. Following the calibration of Maíz Apellániz (2022) with an OB-type prior for the Gaia DR3 parallax, the distance can be much higher:  . Considering that the total mass scales with the distance to the third power and (dGAIA/d)3 ≃ 2.03, the total mass determination could potentially shift to ≃8.70 M⊙. This much higher total mass could help explain the high luminosity of the system, as we could have an ∼8 M⊙ Be star in orbit with an ∼0.5 M⊙ stripped star (consistent with the typical masses of sdOBs; e.g., Arancibia-Rojas et al. 2024), provided that we accept a possible inconsistency on the individual masses determinations from Klement et al. (2025). However, a higher present-day total mass implies higher mass progenitors, which would in turn undergo L2 overflow, given how tight the allowed initial orbital periods are. We confirmed this prediction by producing grids similar to that of Fig. 2 but relaxing the total mass constraint to match a present-day value of ∼8 M⊙, and we found no solutions.
Lastly, one could think of a possible formation scenario that includes a common envelope episode in place of stable MT. This can be motivated by the relatively short period of HR6819 with respect to the other known (bloated) sdOB + Be binaries, which have orbits on the order of months. However, this relatively moderate separation still appears too wide to be the result of CE ejection, according to binary population synthesis studies (e.g. Han et al. 2003). Nevertheless, the uncertainties in common envelope theory would make the outcomes largely unpredictable, and we did not attempt any modeling. We can stress that highly non conservative MT would imply a much larger initial total mass than the present-day value. For case A systems, which is what is needed to achieve the lowest possible stripped star mass, unstable MT can be triggered at moderate-to-dhigh initial mass ratios, but the absence of a defined core-envelope structure would make it harder for the binary to survive (e.g., Ivanova et al. 2013). A Case B or later MT phase offers a greater chance of survival and envelope ejection due to the presence of a compact core, but only stars with masses as low as ∼2.5 M⊙ can produce a ∼0.27 M⊙ helium core at the terminal age MS. Such a star could initiate the common envelope in a binary with a relatively moderate mass ratio, but the constraint on the present-day total mass would be hard to meet if the stripped star progenitor successfully ejects its ∼2.2 M⊙ envelope.
HR6819 is the best constrained system with a puffed-up stripped star + Be star and, compared to the other similar known systems, it exhibits the most extreme mass ratio. Such a mass ratio of mBe/mstripped = 15.7 ± 1.1 is also very extreme when compared with those of the sdOB + Be star system with constrained dynamical solutions (ϕ Persei Mourard et al. 2015; κ Dra Klement et al. 2022; and another 6 in Klement et al. 2024). Among these, HR2142 is the only one showing a more extreme median value for its mass ratio, with mBe/mstripped = 17.12 ± 2.11, mBe = 17.6 ± 5.7 M⊙, and mstripped = 1.03 ± 0.22 M⊙ (see Klement et al. 2024, their Table 5). Within these large uncertainties, this system may still fall within the range of mass ratios achievable with stable MT, given its wider orbital period of P = 80.8733 ± 0.0044 days. Nevertheless, systems like HR6819 and HR2142 might both be pushing the stable MT channel to its limit, substantiating our finding that something is missing from our understanding of how stripped stars + Be star systems can form. Interestingly, Lechien et al. 2025 also point out that both HR6819 and HR2142 are difficult to explain in their study, which assumes that systems evolve through case B stable MT, and state that they might have been formed by case A MT given their short initial periods and high accretion efficiency constraints. In this respect, our study of HR6819 complements theirs and further confirms the problematic nature of the system, since we have investigated both case A and B interactions and found no consistent solution.
Acknowledgments
The authors would like to thank Douglas Gies for reviewing the manuscript and giving helpful comments. AP acknowledges support from the FWO under grant agreement No. 11M8325N (PhD Fellowship), and K209924N, K223124N, K1A4925N (Travel Grants). PM and TS acknowledge support from the European Research Council (ERC) under the European Union’s Horizon 2020 research and innovation programme (grant agreement No. 101165213/Star-Grasp and 101164755/METAL). DP acknowledges financial support from the FWO in the form of a junior postdoctoral fellowship No. 1256225N. JSGM acknowledges having received funding from the European Research Council (ERC) under the Horizon Europe programme (Synergy Grant agreement No. 101071505: 4D-STAR). While partially funded by the European Union, views and opinions expressed are however those of the authors only and do not necessarily reflect those of the European Union or the European Research Council. Neither the European Union nor the granting authority can be held responsible for them. The resources and services used in this work were provided by the VSC (Flemish Supercomputer Center), funded by the Research Foundation – Flanders (FWO) and the Flemish Government.
References
- Angulo, C., Arnould, M., Rayet, M., et al. 1999, Nucl. Phys. A, 656, 3 [Google Scholar]
- Arancibia-Rojas, E., Zorotovic, M., Vučković, M., et al. 2024, MNRAS, 527, 11184 [Google Scholar]
- Bao, Y., Li, Z., Ge, H., Chen, X., & Han, Z. 2025, ApJ, 987, 210 [Google Scholar]
- Bauer, E. B., & Kupfer, T. 2021, ApJ, 922, 245 [NASA ADS] [CrossRef] [Google Scholar]
- Bodensteiner, J., Shenar, T., Mahy, L., et al. 2020, A&A, 641, A43 [NASA ADS] [CrossRef] [EDP Sciences] [Google Scholar]
- Bodensteiner, J., Heida, M., Abdul-Masih, M., et al. 2022, The Messenger, 186, 3 [NASA ADS] [Google Scholar]
- Böhm-Vitense, E. 1958, Z. Astrophys., 46, 108 [Google Scholar]
- Brott, I., de Mink, S. E., Cantiello, M., et al. 2011, A&A, 530, A115 [NASA ADS] [CrossRef] [EDP Sciences] [Google Scholar]
- Claeys, J. S. W., de Mink, S. E., Pols, O. R., Eldridge, J. J., & Baes, M. 2011, A&A, 528, A131 [NASA ADS] [CrossRef] [EDP Sciences] [Google Scholar]
- Claret, A., & Torres, G. 2016, A&A, 592, A15 [NASA ADS] [CrossRef] [EDP Sciences] [Google Scholar]
- Crowther, P. A. 2007, ARA&A, 45, 177 [Google Scholar]
- Cyburt, R. H., Amthor, A. M., Ferguson, R., et al. 2010, ApJS, 189, 240 [NASA ADS] [CrossRef] [Google Scholar]
- de Mink, S. E., Langer, N., Izzard, R. G., Sana, H., & de Koter, A. 2013, ApJ, 764, 166 [Google Scholar]
- Deschamps, R., Siess, L., Davis, P. J., & Jorissen, A. 2013, A&A, 557, A40 [NASA ADS] [CrossRef] [EDP Sciences] [Google Scholar]
- Drout, M. R., Götberg, Y., Ludwig, B. A., et al. 2023, Science, 382, 1287 [NASA ADS] [CrossRef] [Google Scholar]
- Dutta, D., & Klencki, J. 2024, A&A, 687, A215 [NASA ADS] [CrossRef] [EDP Sciences] [Google Scholar]
- Eggleton, P. P. 1983, ApJ, 268, 368 [Google Scholar]
- Ekström, S., Meynet, G., Maeder, A., & Barblan, F. 2008, A&A, 478, 467 [Google Scholar]
- El-Badry, K., & Burdge, K. B. 2022, MNRAS, 511, 24 [NASA ADS] [CrossRef] [Google Scholar]
- El-Badry, K., & Quataert, E. 2021, MNRAS, 502, 3436 [NASA ADS] [CrossRef] [Google Scholar]
- Fabry, M., Marchant, P., Langer, N., & Sana, H. 2025, A&A, 695, A109 [NASA ADS] [CrossRef] [EDP Sciences] [Google Scholar]
- Frost, A. J., Bodensteiner, J., Rivinius, T., et al. 2022, A&A, 659, L3 [NASA ADS] [CrossRef] [EDP Sciences] [Google Scholar]
- Fuller, G. M., Fowler, W. A., & Newman, M. J. 1985, ApJ, 293, 1 [NASA ADS] [CrossRef] [Google Scholar]
- Gies, D. R., & Wang, L. 2020, ApJ, 898, L44 [NASA ADS] [CrossRef] [Google Scholar]
- Gies, D. R., Bagnuolo, W. G., Jr, Ferrara, E. C., et al. 1998, ApJ, 493, 440 [NASA ADS] [CrossRef] [Google Scholar]
- Götberg, Y., de Mink, S. E., Groh, J. H., et al. 2018, A&A, 615, A78 [NASA ADS] [CrossRef] [EDP Sciences] [Google Scholar]
- Götberg, Y., Drout, M. R., Ji, A. P., et al. 2023, ApJ, 959, 125 [CrossRef] [Google Scholar]
- Granada, A., Ekström, S., Georgy, C., et al. 2013, A&A, 553, A25 [NASA ADS] [CrossRef] [EDP Sciences] [Google Scholar]
- GRAVITY Collaboration (Abuter, R., et al.) 2017, A&A, 602, A94 [NASA ADS] [CrossRef] [EDP Sciences] [Google Scholar]
- Grevesse, N., Noels, A., & Sauval, A. J. 1996, ASP Conf. Ser., 99, 117 [Google Scholar]
- Hamann, W. R., Koesterke, L., & Wessolowski, U. 1995, A&A, 299, 151 [Google Scholar]
- Han, Z., Podsiadlowski, P., Maxted, P. F. L., & Marsh, T. R. 2003, MNRAS, 341, 669 [NASA ADS] [CrossRef] [Google Scholar]
- Hastings, B., Wang, C., & Langer, N. 2020, A&A, 633, A165 [NASA ADS] [CrossRef] [EDP Sciences] [Google Scholar]
- Haubois, X., Mérand, A., Abuter, R., et al. 2022, SPIE Conf. Ser., 12183, 1218306 [Google Scholar]
- Heber, U. 2024, ArXiv e-prints [arXiv:2410.11663] [Google Scholar]
- Heber, U., Edelmann, H., Lisker, T., & Napiwotzki, R. 2003, A&A, 411, L477 [NASA ADS] [CrossRef] [EDP Sciences] [Google Scholar]
- Herwig, F. 2000, A&A, 360, 952 [NASA ADS] [Google Scholar]
- Iglesias, C. A., & Rogers, F. J. 1996, ApJ, 464, 943 [NASA ADS] [CrossRef] [Google Scholar]
- Irrgang, A., Geier, S., Kreuzer, S., Pelisoli, I., & Heber, U. 2020, A&A, 633, L5 [NASA ADS] [CrossRef] [EDP Sciences] [Google Scholar]
- Irrgang, A., Przybilla, N., & Meynet, G. 2022, Nat. Astron., 6, 1414 [NASA ADS] [CrossRef] [Google Scholar]
- Ivanova, N., Justham, S., Chen, X., et al. 2013, A&ARv, 21, 59 [Google Scholar]
- Jermyn, A. S., Bauer, E. B., Schwab, J., et al. 2023, ApJS, 265, 15 [NASA ADS] [CrossRef] [Google Scholar]
- Kippenhahn, R., & Weigert, A. 1967, Z. Astrophys., 65, 251 [NASA ADS] [Google Scholar]
- Kippenhahn, R., Ruschenplatt, G., & Thomas, H. C. 1980, A&A, 91, 175 [Google Scholar]
- Klement, R., Baade, D., Rivinius, T., et al. 2022, ApJ, 940, 86 [NASA ADS] [CrossRef] [Google Scholar]
- Klement, R., Rivinius, T., Gies, D. R., et al. 2024, ApJ, 962, 70 [NASA ADS] [CrossRef] [Google Scholar]
- Klement, R., Rivinius, T., Baade, D., et al. 2025, A&A, 694, A208 [NASA ADS] [CrossRef] [EDP Sciences] [Google Scholar]
- Kupfer, T., Geier, S., Heber, U., et al. 2015, A&A, 576, A44 [NASA ADS] [CrossRef] [EDP Sciences] [Google Scholar]
- Langanke, K., & Martínez-Pinedo, G. 2000, Nucl. Phys. A, 673, 481 [NASA ADS] [CrossRef] [Google Scholar]
- Langer, N., Fricke, K. J., & Sugimoto, D. 1983, A&A, 126, 207 [NASA ADS] [Google Scholar]
- Langer, N., Wellstein, S., & Petrovic, J. 2003, IAU Symp., 212, 275 [Google Scholar]
- Lechien, T., de Mink, S. E., Valli, R., et al. 2025, ApJ, 990, L51 [Google Scholar]
- Ledoux, P. 1947, ApJ, 105, 305 [NASA ADS] [CrossRef] [Google Scholar]
- Liu, J., Zhang, H., Howard, A. W., et al. 2019, Nature, 575, 618 [Google Scholar]
- Lu, W., Fuller, J., Quataert, E., & Bonnerot, C. 2023, MNRAS, 519, 1409 [Google Scholar]
- Ludwig, B., Drout, M. R., Gotberg, Y., Lang, D., & Laroche, A. 2025, ApJ, submitted [arXiv:2505.18632] [Google Scholar]
- Maíz Apellániz, J. 2022, A&A, 657, A130 [NASA ADS] [CrossRef] [EDP Sciences] [Google Scholar]
- Marchant, P., Langer, N., Podsiadlowski, P., Tauris, T. M., & Moriya, T. J. 2016, A&A, 588, A50 [NASA ADS] [CrossRef] [EDP Sciences] [Google Scholar]
- Mourard, D., Monnier, J. D., Meilland, A., et al. 2015, A&A, 577, A51 [NASA ADS] [CrossRef] [EDP Sciences] [Google Scholar]
- Oda, T., Hino, M., Muto, K., Takahara, M., & Sato, K. 1994, Atom. Data Nucl. Data Tables, 56, 231 [Google Scholar]
- Packet, W. 1981, A&A, 102, 17 [NASA ADS] [Google Scholar]
- Paczyński, B. 1971, ARA&A, 9, 183 [Google Scholar]
- Paxton, B., Bildsten, L., Dotter, A., et al. 2011, ApJS, 192, 3 [Google Scholar]
- Paxton, B., Cantiello, M., Arras, P., et al. 2013, ApJS, 208, 4 [Google Scholar]
- Paxton, B., Marchant, P., Schwab, J., et al. 2015, ApJS, 220, 15 [Google Scholar]
- Paxton, B., Schwab, J., Bauer, E. B., et al. 2018, ApJS, 234, 34 [NASA ADS] [CrossRef] [Google Scholar]
- Paxton, B., Smolec, R., Schwab, J., et al. 2019, ApJS, 243, 10 [Google Scholar]
- Pols, O. R. 2007, ASP Conf. Ser., 367, 387 [Google Scholar]
- Pourbaix, D., Tokovinin, A. A., Batten, A. H., et al. 2004, A&A, 424, 727 [NASA ADS] [CrossRef] [EDP Sciences] [Google Scholar]
- Rivinius, T., Carciofi, A. C., & Martayan, C. 2013, A&ARv., 21 [Google Scholar]
- Rivinius, T., Baade, D., Hadrava, P., Heida, M., & Klement, R. 2020, A&A, 637, L3 [NASA ADS] [CrossRef] [EDP Sciences] [Google Scholar]
- Rivinius, T., Klement, R., Chojnowski, S. D., et al. 2025, A&A, 694, A172 [NASA ADS] [CrossRef] [EDP Sciences] [Google Scholar]
- Sana, H., de Mink, S. E., de Koter, A., et al. 2012, Science, 337, 444 [Google Scholar]
- Saracino, S., Kamann, S., Guarcello, M. G., et al. 2022, MNRAS, 511, 2914 [NASA ADS] [CrossRef] [Google Scholar]
- Schaffenroth, V., Pelisoli, I., Barlow, B. N., Geier, S., & Kupfer, T. 2022, A&A, 666, A182 [NASA ADS] [CrossRef] [EDP Sciences] [Google Scholar]
- Schneider, F. R. N., Langer, N., de Koter, A., et al. 2014, A&A, 570, A66 [NASA ADS] [CrossRef] [EDP Sciences] [Google Scholar]
- Shao, Y., & Li, X.-D. 2014, ApJ, 796, 37 [Google Scholar]
- Shenar, T., Gilkis, A., Vink, J. S., Sana, H., & Sander, A. A. C. 2020, A&A, 634, A79 [NASA ADS] [CrossRef] [EDP Sciences] [Google Scholar]
- Shenar, T., Wade, G. A., Marchant, P., et al. 2023, Science, 381, 761 [NASA ADS] [CrossRef] [Google Scholar]
- Soberman, G. E., Phinney, E. S., & van den Heuvel, E. P. J. 1997, A&A, 327, 620 [NASA ADS] [Google Scholar]
- Tauris, T. M., & van den Heuvel, E. 2023, Physics of Binary Star Evolution: From Stars to X-ray Binaries and Gravitational Wave Sources (Princeton, NJ: Princeton University Press) [Google Scholar]
- van den Heuvel, E. P. J. 1975, ApJ, 198, L109 [NASA ADS] [CrossRef] [Google Scholar]
- van Rensbergen, W., De Greve, J. P., De Loore, C., & Mennekens, N. 2008, A&A, 487, 1129 [NASA ADS] [CrossRef] [EDP Sciences] [Google Scholar]
- van Roestel, J., Kupfer, T., Ruiz-Carmona, R., et al. 2018, MNRAS, 475, 2560 [CrossRef] [Google Scholar]
- Villaseñor, J. I., Lennon, D. J., Picco, A., et al. 2023, MNRAS, 525, 5121 [CrossRef] [Google Scholar]
- Vink, J. S., de Koter, A., & Lamers, H. J. G. L. M. 2001, A&A, 369, 574 [NASA ADS] [CrossRef] [EDP Sciences] [Google Scholar]
- Vos, J., Németh, P., Vučković, M., Østensen, R., & Parsons, S. 2018, MNRAS, 473, 693 [NASA ADS] [CrossRef] [Google Scholar]
- Wang, L., Gies, D. R., Peters, G. J., et al. 2021, AJ, 161, 248 [Google Scholar]
- Wang, L., Gies, D. R., Peters, G. J., & Han, Z. 2023, AJ, 165, 203 [NASA ADS] [CrossRef] [Google Scholar]
- Xu, X.T., Schürmann, C., Langer, N., et al. 2025, A&A, 704, A218 [NASA ADS] [CrossRef] [EDP Sciences] [Google Scholar]
- Yoon, S. C., & Langer, N. 2005, A&A, 443, 643 [NASA ADS] [CrossRef] [EDP Sciences] [Google Scholar]
- Zhang, X., Chen, X., & Han, Z. 2009, A&A, 504, L13 [NASA ADS] [CrossRef] [EDP Sciences] [Google Scholar]
The BONNSAI web-service is available at https://www.astro.uni-bonn.de/stars/bonnsai/.
Appendix A: Details of MESA simulations
Our simulations are computed using version 24.03.1 of MESA. Our setup is similar to that of Marchant et al. (2016), to which we refer for more details. We set the initial composition to correspond to the Galactic one from Brott et al. (2011), for both stars. We used custom opacity tables computed from the OPAL project (Iglesias & Rogers 1996) with solar-scaled metal abundances from Grevesse et al. (1996).
Convection was modelled using the Ledoux criterion (Ledoux 1947) within the standard mixing-length theory (Böhm-Vitense 1958), with a mixing-length parameter αMLT = 1.5. Semiconvection was modelled according to Langer et al. (1983) with an efficiency parameter αsc = 1. For hydrogen burning cores, we include step-overshooting extending the convective region by 0.10 pressure scale height at the convective boundary (but see main text where we discussed the impact of varying this number). For convective cores after the main-sequence we include exponential overshooting (Herwig 2000) with decay length of f= 0.01. Thermohaline mixing is modeled as in Kippenhahn et al. (1980) with an efficiency parameter of αth = 1.
Stellar winds follow Yoon & Langer (2005), with mass-loss rates for hydrogen-rich stars (with a surface helium abundance Y < 0.4) computed as in Vink et al. (2001), while for hydrogen-poor stars (Y > 0.7) we use those from Hamann et al. (1995) multiplied by a factor of one tenth. In the range 0.4< Y < 0.7, the rate is interpolated between the two.
Nuclear reaction rates in MESA are from JINA REACLIB (Cyburt et al. 2010), NACRE (Angulo et al. 1999) and additional tabulated weak reaction rates Fuller et al. (1985), Oda et al. (1994), Langanke & Martínez-Pinedo (2000). We use the simple networks provided with MESA basic.net for H and He burning, co_burn.net for C and O burning, and approx21.net for later phases, with the inclusion of iron and calcium.
Roche lobe radii in binary systems are computed using the fit of Eggleton (1983). Mass transfer rates in Roche lobe overflowing binary systems are computed with the contact scheme from Marchant et al. (2016). This is an implicit scheme in which the mass transfer rate is iteratively adjusted to ensure that the donor star remains within its Roche lobe. The method can also accommodate contact phases where both stars overfill their Roche lobes, provided that mass loss through the second Lagrangian point L2 does not occur.
Appendix B: Parameter variations
B.1. Reduced overshooting
All our simulations have been carried out with a step-overshooting scheme of the hydrogen burning convective core, extending its size by 0.1 pressure scale heights. This was picked because lower overshooting values ∼ 0.1-0.2 have been proposed for lower-mass stars based on double-lined eclipsing binaries (Claret & Torres 2016). To evaluate the impact of this choice, we re-computed our grids with a much lower value αov = 0.01, to see if the limit on the maximum mass ratio at Ptoday achievable with stable MT would significantly shift. We show the result of the comparison in Fig. B.1. Notice that we have also computed grids of simulations with qr = 12.5 and 0.50 ≤ ϵ ≤ 1.00, spaced by Δϵ = 0.50, but found no solution.
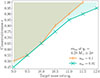 |
Fig. B.1. Comparison of our grid exploration for different conservativeness degree ϵ and different target mass ratios qr, for two different values of the overshooting parameter. The area is filled where a solution with qdetach ≥ qr is found for a value of the present-day total mass mtot, r within 2σ uncertainty. The scatter points along the respective lines indicate where the minimum value of ϵ that gives a solution is found. |
B.2. Average orbital angular momentum
We introduce a fixed fraction αavg of material leaving the system with the average specific orbital momentum of the system (the total angular momentum of the orbit, divided by its total mass). Under these assumptions, one can derive another map between the initial orbital period Pi and the reference period Pr:
 (B.1)
(B.1)
where the efficiency ϵ is defined as
 (B.2)
(B.2)
Notice that the exponents show a factor αavg/(1 − ϵ): when MT is fully conservative (non conservative), this factor is zero (unity). We use this map combined with the total mass constraint in Eq. 3 to determine initial conditions for a new set of grids, analogously to Sect. 2. The results are shown in Fig. B.2, compared with the isotropic re-emission mode. Grids of simulations with qr = 12 and 0.50 ≤ ϵ ≤ 1.00, spaced by Δϵ = 0.50, gave no solution.
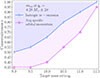 |
Fig. B.2. Similar to Fig. B.1, but comparing two different angular momentum loss mechanisms: isotropic re-emission with efficiency β = 1 − ϵ, and loss of a fixed fraction αavg = 1 − ϵ of the specific total orbital momentum. |
All Tables
All Figures
|
Fig. 1. Orbital period, P, of the binary system as a function of mass ratio q, assuming a present-day period of Pr ∼ 40 days and the two estimates of the current mass ratio from spectroscopy alone (pink; Bodensteiner et al. 2020, 15 ± 3) and combined spectroscopy and optical interferometry (purple; Klement et al. 2025, 15.7 ± 1.1), with their respective uncertainties (lighter colored bands around the respective line). HR6819 properties from these two works are also reported as scatter points, with their error bars on the mass ratio (the error bars on the period are too small to be visible). MT is assumed to be either fully conservative (solid) with ϵ = 1 or fully non conservative (dashed) with β = 1. Circles represent a selection of detached and semidetached systems from the SB9 catalogue, as in Figure 15 from Bodensteiner et al. (2020); see also their Appendix D. |
| In the text | |
|
Fig. 2. Contour levels of initial orbital periods, Pi, allowed by stable MT with ϵ = 1 efficiency, if the period at detachment is imposed to be Pr = Ptoday from Table 1 and the reference mass ratio is qr = 10.5. We populate the lines of constant total mass at the present-day with MESA simulations, represented by their outcome with color-coded pixels. If these simulations reach a mass ratio at detachment qdetach such that qdetach ≥ qr, we mark them as hits (blue edges). This is shown as a function of stripped and Be star initial masses, mstripped, i and mBe, i. The black region indicates initial mass ratios of qi > 1, and the solid black line delimiting the base of the contour plot corresponds to qi = 0.25; i.e., the lowest mass ratio we evolved. |
| In the text | |
|
Fig. 3. Summary plot of our grid exploration for different degrees of conservativeness, ϵ, and different target mass ratios, qr. The area is filled where at least a solution with qdetach ≥ qr is found, for three different values of the present-day total massx, mtot, r: median (violet, with circular hatching); −2σ value (cyan, with shading); +2σ (salmon, with diagonal hatching). The scatter points along the respective lines indicate where the minimum value of ϵ that gives a solution is found. |
| In the text | |
|
Fig. 4. Detachment mass ratio as function of initial mass ratio for a selection of our results. The three panels refer to three different grids for target mass ratio qr as indicated by the dashed red line, which also corresponds to a detachment period of Pr = Ptoday, by construction. Different MT efficiencies are color-coded according to the color bar, and the scatter points mark case A (x marker) and case B (triangle marker) MT. The systems have total mass mtot, r = 4.28 M⊙ (median for HR6819) at qr. In the first panel, we also show the detachment ratios corresponding to periods of 60 and 90 days in gray, as a reference. |
| In the text | |
|
Fig. 5. HR diagram showing the evolution of a system composed of a primary (the stripped star progenitor) with mstripped, i = 3.3 M⊙ and a secondary (the Be star progenitor) with mBe, i = 1.7 M⊙, in orbit with an initial period of Pi = 1.5 days. The system evolves via fully conservative MT. Dots along the tracks are separated by 0.1 Myr of evolution. Purple and blue highlighted regions correspond to mass transfer on the MS (case A) and after the MS (case AB), respectively. The scatter points mark the observed locations of HR6819 according to Bodensteiner et al. (2020), with 1σ error bars. An evolutionary track for a donor star (ZAMS mass 4.6 M⊙) undergoing case B mass transfer is shown in blue as it crosses HR6819’s observable at its median. The ZAMS and stripped stars’ masses for every track are also reported along the track with corresponding colors. |
| In the text | |
|
Fig. B.1. Comparison of our grid exploration for different conservativeness degree ϵ and different target mass ratios qr, for two different values of the overshooting parameter. The area is filled where a solution with qdetach ≥ qr is found for a value of the present-day total mass mtot, r within 2σ uncertainty. The scatter points along the respective lines indicate where the minimum value of ϵ that gives a solution is found. |
| In the text | |
|
Fig. B.2. Similar to Fig. B.1, but comparing two different angular momentum loss mechanisms: isotropic re-emission with efficiency β = 1 − ϵ, and loss of a fixed fraction αavg = 1 − ϵ of the specific total orbital momentum. |
| In the text | |
Current usage metrics show cumulative count of Article Views (full-text article views including HTML views, PDF and ePub downloads, according to the available data) and Abstracts Views on Vision4Press platform.
Data correspond to usage on the plateform after 2015. The current usage metrics is available 48-96 hours after online publication and is updated daily on week days.
Initial download of the metrics may take a while.