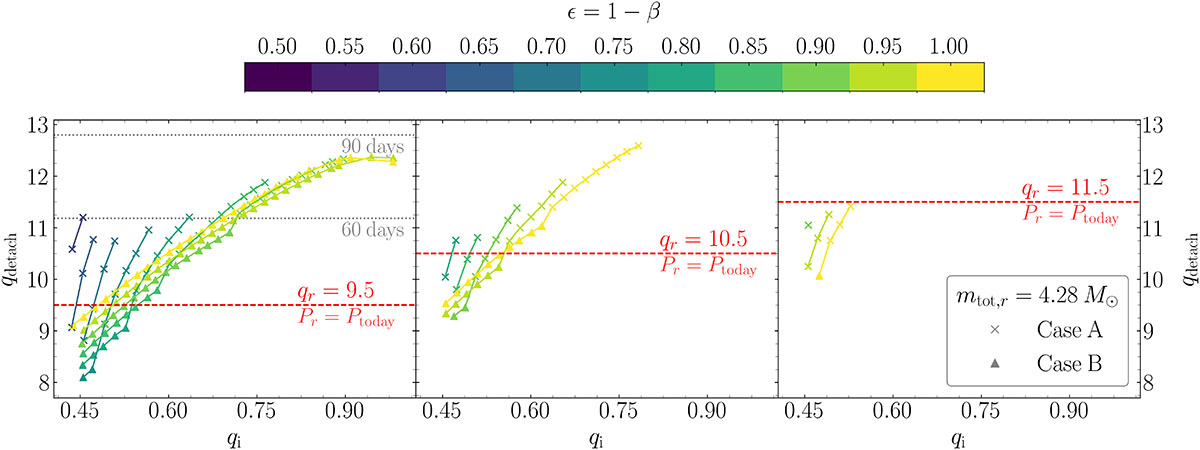
Fig. 4.
Download original image
Detachment mass ratio as function of initial mass ratio for a selection of our results. The three panels refer to three different grids for target mass ratio qr as indicated by the dashed red line, which also corresponds to a detachment period of Pr = Ptoday, by construction. Different MT efficiencies are color-coded according to the color bar, and the scatter points mark case A (x marker) and case B (triangle marker) MT. The systems have total mass mtot, r = 4.28 M⊙ (median for HR6819) at qr. In the first panel, we also show the detachment ratios corresponding to periods of 60 and 90 days in gray, as a reference.
Current usage metrics show cumulative count of Article Views (full-text article views including HTML views, PDF and ePub downloads, according to the available data) and Abstracts Views on Vision4Press platform.
Data correspond to usage on the plateform after 2015. The current usage metrics is available 48-96 hours after online publication and is updated daily on week days.
Initial download of the metrics may take a while.