Fig. 5.
Download original image
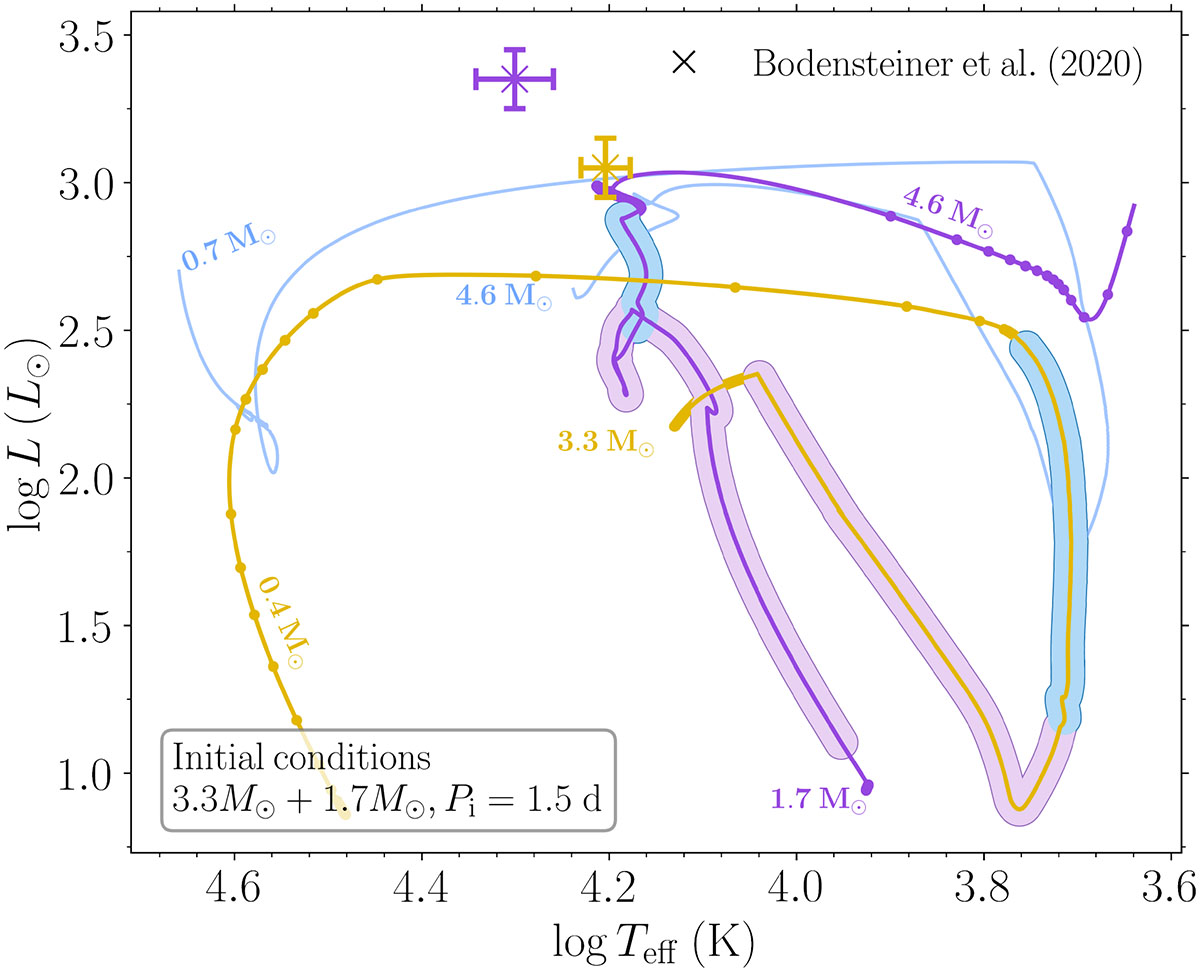
HR diagram showing the evolution of a system composed of a primary (the stripped star progenitor) with mstripped, i = 3.3 M⊙ and a secondary (the Be star progenitor) with mBe, i = 1.7 M⊙, in orbit with an initial period of Pi = 1.5 days. The system evolves via fully conservative MT. Dots along the tracks are separated by 0.1 Myr of evolution. Purple and blue highlighted regions correspond to mass transfer on the MS (case A) and after the MS (case AB), respectively. The scatter points mark the observed locations of HR6819 according to Bodensteiner et al. (2020), with 1σ error bars. An evolutionary track for a donor star (ZAMS mass 4.6 M⊙) undergoing case B mass transfer is shown in blue as it crosses HR6819’s observable at its median. The ZAMS and stripped stars’ masses for every track are also reported along the track with corresponding colors.
Current usage metrics show cumulative count of Article Views (full-text article views including HTML views, PDF and ePub downloads, according to the available data) and Abstracts Views on Vision4Press platform.
Data correspond to usage on the plateform after 2015. The current usage metrics is available 48-96 hours after online publication and is updated daily on week days.
Initial download of the metrics may take a while.