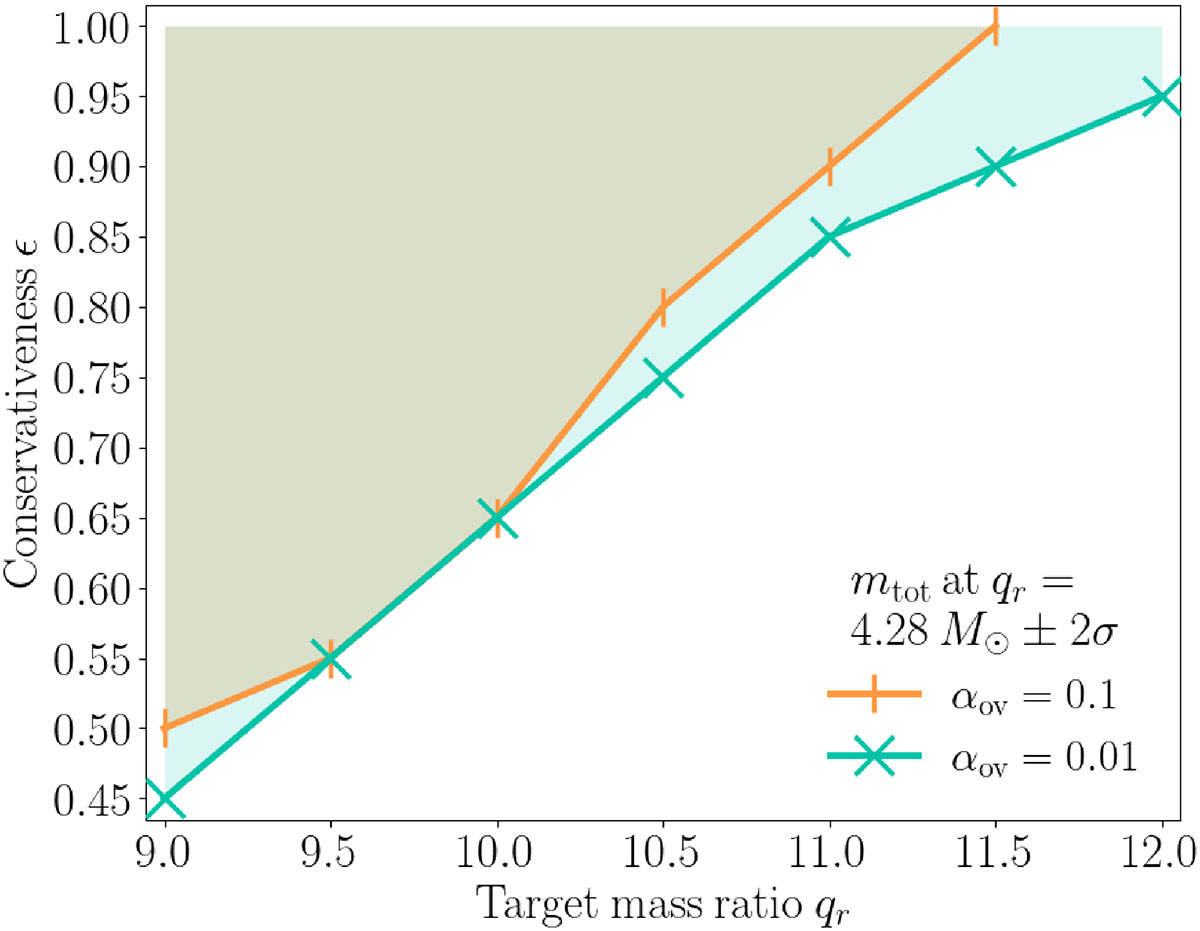
Fig. B.1.
Download original image
Comparison of our grid exploration for different conservativeness degree ϵ and different target mass ratios qr, for two different values of the overshooting parameter. The area is filled where a solution with qdetach ≥ qr is found for a value of the present-day total mass mtot, r within 2σ uncertainty. The scatter points along the respective lines indicate where the minimum value of ϵ that gives a solution is found.
Current usage metrics show cumulative count of Article Views (full-text article views including HTML views, PDF and ePub downloads, according to the available data) and Abstracts Views on Vision4Press platform.
Data correspond to usage on the plateform after 2015. The current usage metrics is available 48-96 hours after online publication and is updated daily on week days.
Initial download of the metrics may take a while.