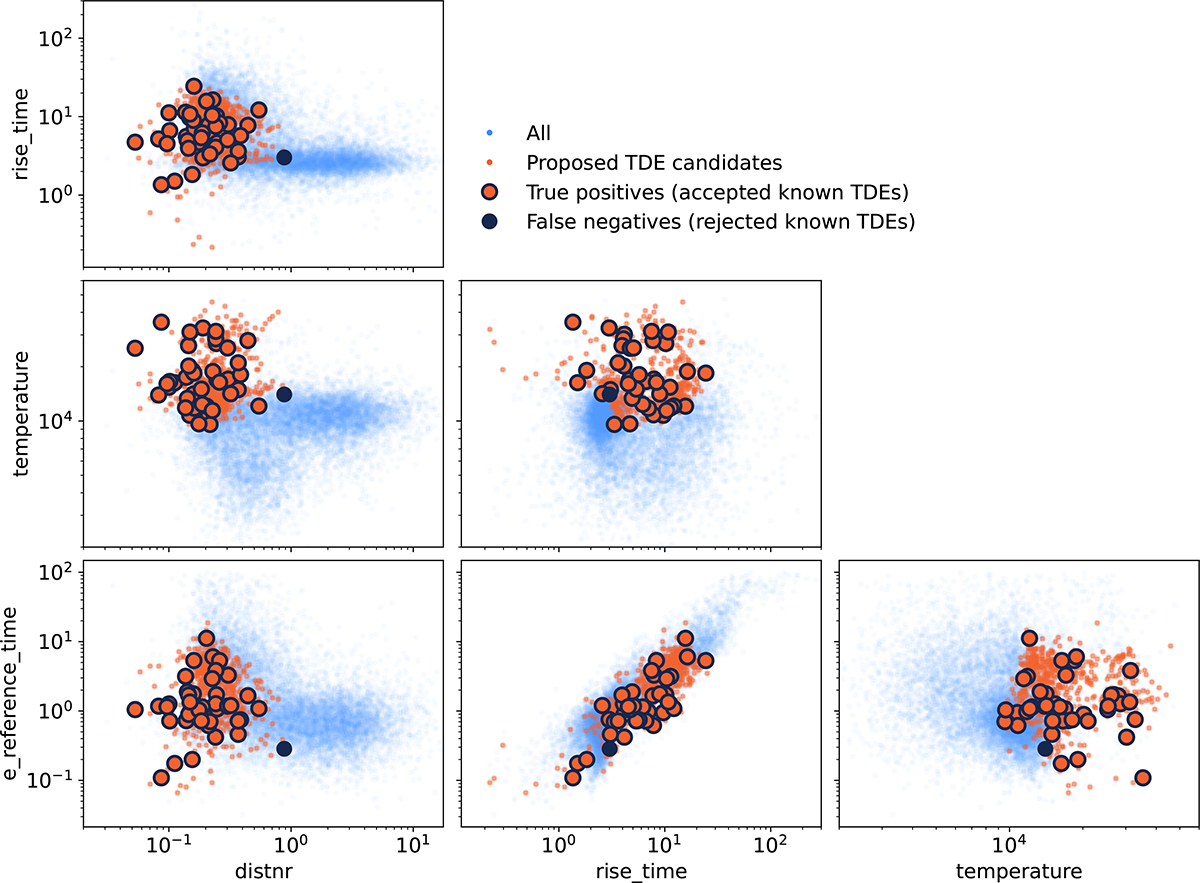
Fig. 3.
Download original image
Corner plot showing the complete feature space for the nuclear model on the whole dataset. The small blue dots show the positions of all points in the dataset, and orange dots mark the TDE candidates proposed by the classifier. The orange and dark blue circles show the positions of known TDEs that were accepted and rejected by the classifier, respectively. In contrast to the results shown by the leave-one-out cross-validation in Fig. 2, only one known TDE is not identified by the model in this test because all these TDEs were included in the training set. This outlier is the off-nuclear optical TDE 2024tvd.
Current usage metrics show cumulative count of Article Views (full-text article views including HTML views, PDF and ePub downloads, according to the available data) and Abstracts Views on Vision4Press platform.
Data correspond to usage on the plateform after 2015. The current usage metrics is available 48-96 hours after online publication and is updated daily on week days.
Initial download of the metrics may take a while.