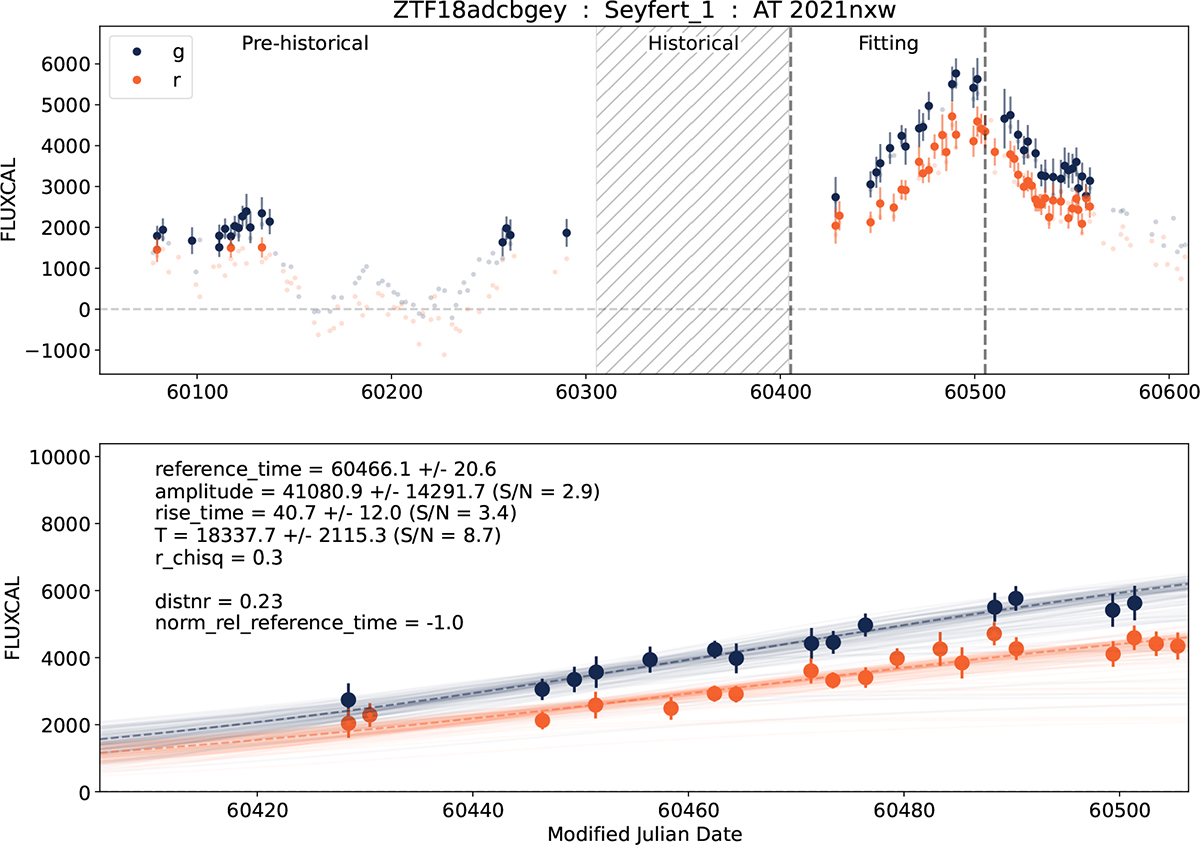
Fig. A.1.
Download original image
Illustration on the window selection and feature extraction processes. The upper panel shows the complete light curve extracted from the alerts (full circles) and from data-release photometry (translucent dots) with the fitting, historical and pre-historical windows described in Sect. 3.1 indicated for context. Lower panel displays the data points within the 100-day fitting window, along with the corresponding RAINBOW fit output (Sect. 3.2). The dashed lines correspond to the best fit parameter values, while the translucent ones show the scatter of models with parameters sampled around the best fit according to the estimated covariances. The in-figure annotation lists the values of the best fit parameters along with their uncertainties, as well as some additional features such as distnr.
Current usage metrics show cumulative count of Article Views (full-text article views including HTML views, PDF and ePub downloads, according to the available data) and Abstracts Views on Vision4Press platform.
Data correspond to usage on the plateform after 2015. The current usage metrics is available 48-96 hours after online publication and is updated daily on week days.
Initial download of the metrics may take a while.