Fig. 3.
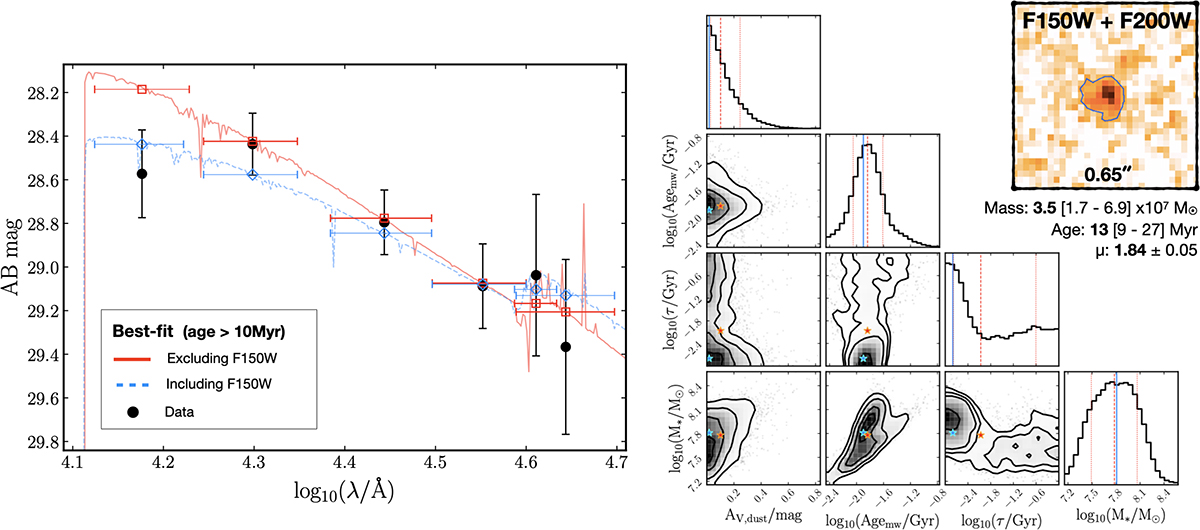
Download original image
Corner plot (right) and SED fitting results of the CI (left). We fixed z = 9.625 throughout and adopted an age not younger than 10 Myr (see text for more details). Red and blue lines on the left indicate fits respectively excluding or including the F150W data point. The red line shows the fiducial SED fit solution (see Fig. B.1 for a comparison of corner plots with and without the F150W band data point). Horizontal bars indicate the bandwidth. In the right panel, the inset shows the stacked short wavelength bands (F150W + F200W) image of the CI, where the 2σ contour is outlined. The blue and red stars in the corner plot mark the best and median solutions. The same is indicated with the vertical blue line (best solution) and the dotted and dashed red lines (median and 16−84% percentiles). The mass-weighted age and the current stellar mass are reported.
Current usage metrics show cumulative count of Article Views (full-text article views including HTML views, PDF and ePub downloads, according to the available data) and Abstracts Views on Vision4Press platform.
Data correspond to usage on the plateform after 2015. The current usage metrics is available 48-96 hours after online publication and is updated daily on week days.
Initial download of the metrics may take a while.