| Issue |
A&A
Volume 705, January 2026
|
|
|---|---|---|
| Article Number | A171 | |
| Number of page(s) | 11 | |
| Section | Extragalactic astronomy | |
| DOI | https://doi.org/10.1051/0004-6361/202556570 | |
| Published online | 19 January 2026 | |
The z = 9.625 Cosmic Gems galaxy was a compact “blue monster” propelled by massive star clusters★
1
INAF – OAS, Osservatorio di Astrofisica e Scienza dello Spazio di Bologna Via Gobetti 93/3 I-40129 Bologna, Italy
2
Department of Astronomy, Oskar Klein Centre, Stockholm University, AlbaNova University Center SE-106 91 Stockholm, Sweden
3
Center for Frontier Science, Chiba University, 1-33 Yayoi-cho Inage-ku Chiba 263-8522, Japan
4
Department of Physics, Graduate School of Science, Chiba University, 1-33 Yayoi-Cho Inage-Ku Chiba 263-8522, Japan
5
Department of Astronomy, University of Michigan 1085 South University Avenue Ann Arbor MI 48109, USA
6
Space Telescope Science Institute (STScI) 3700 San Martin Drive Baltimore MD 21218, USA
7
Dipartimento di Fisica, Università degli Studi di Milano Via Celoria 16 I-20133 Milano, Italy
8
Univ. Lyon, Univ. Lyon1, ENS de Lyon, CNRS, Centre de Recherche Astrophysique de Lyon UMR5574 Saint-Genis-Laval, France
9
Astrophysics Science Division, Code 660, NASA Goddard Space Flight Center 8800 Greenbelt Rd. Greenbelt MD 20771, USA
10
Department of Astronomy, University of Maryland College Park 20742, USA
11
University of Ljubljana, Faculty of Mathematics and Physics Jadranska ulica 19 SI-1000 Ljubljana, Slovenia
12
Max-Planck-Institut für Astrophysik Karl-Schwarzschild-Str. 1 D-85748 Garching, Germany
13
INAF – IASF Milano Via A. Corti 12 I-20133 Milano, Italy
14
Center for Astrophysics | Harvard & Smithsonian 60 Garden Street Cambridge MA 02138, USA
15
Center for Astrophysical Sciences, Department of Physics and Astronomy, The Johns Hopkins University 3400 N Charles St. Baltimore MD 21218, USA
16
Observational Astrophysics, Department of Physics and Astronomy, Uppsala University Box 516 SE-751 20 Uppsala, Sweden
17
Niels Bohr Institute, University of Copenhagen Jagtvej 128 DK-2200 Copenhagen N, Denmark
18
Cosmic Dawn Center (DAWN), University of Copenhagen 2200 Copenhagen N, Denmark
19
Instituto de Física de Cantabria (CSIC-UC) Avda. Los Castros s/n 39005 Santander, Spain
20
Instituto de Alta Investigación, Universidad de Tarapacá Casilla 7D Arica, Chile
21
Center for Interdisciplinary Exploration and Research in Astrophysics (CIERA) 1800 Sherman Avenue Evanston IL 60201, USA
22
David A. Dunlap Department of Astronomy and Astrophysics, University of Toronto 50 St. George Street Toronto Ontario M5S 3H4, Canada
23
Dunlap Institute for Astronomy and Astrophysics 50 St. George Street Toronto Ontario M5S 3H4, Canada
24
Dipartimento di Fisica e Scienze della Terra, Università degli Studi di Ferrara Via Saragat 1 I-44122 Ferrara, Italy
25
Department of Physics, Ben-Gurion University of the Negev P.O. Box 653 Be’er-Sheva 84105, Israel
26
European Space Agency (ESA), European Space Astronomy Centre (ESAC) Camino Bajo del Castillo s/n 28692 Villanueva de la Cañada Madrid, Spain
27
Department of Astronomy/Steward Observatory, University of Arizona 933 N. Cherry Avenue Tucson AZ 85721, USA
28
Department of Physics, School of Advanced Science and Engineering, Faculty of Science and Engineering, Waseda University, 3-4-1 Okubo Shinjuku Tokyo 169-8555, Japan
29
Waseda Research Institute for Science and Engineering, Faculty of Science and Engineering, Waseda University, 3-4-1 Okubo Shinjuku Tokyo 169-8555, Japan
30
Instituto de Astrofísica de Andalucía–CSIC Glorieta de la Astronomía s/n E-18008 Granada, Spain
31
Observatório Nacional – MCTI (ON), Rua General José Cristino 77 São Cristóvão 20921-400 Rio de Janeiro, Brazil
32
School of Physics, University of Melbourne, Parkville Vic 3010, Australia
33
Division of Physics, Faculty of Pure and Applied Sciences, University of Tsukuba Tsukuba Ibaraki 305-8571, Japan
34
ARC Centre of Excellence for All Sky Astrophysics in 3 Dimensions (ASTRO 3D), Australia
★★ Corresponding author: This email address is being protected from spambots. You need JavaScript enabled to view it.
Received:
23
July
2025
Accepted:
2
November
2025
Abstract
The recent discovery of five massive stellar clusters at z = 9.625 in the Cosmic Gems galaxy has raised the question about the formation mechanism of star clusters in the first 500 Myr after the Big Bang. We inferred the total stellar mass in clusters by normalizing and integrating the stellar cluster mass function (SCMF, dn(M)/dM = n0Mβ), assuming three different slopes (β = −1.5, −2.0, and −2.5) and different lower-mass limits between 102 and 105 M⊙. We compared the total integrated cluster stellar mass to the stellar mass inferred from the counter image of the Cosmic Gems, which provides the best modestly magnified (μ = 1.84 ± 0.05) representation of the entire galaxy. The delensed stellar mass of the Cosmic Gems galaxy was estimated as 3.5−1.8+3.3× 10⁷ M⊙, with an effective radius of Reff = 103−15+13 parsecs and a stellar surface mass density of Σmass = 520−225+340 M⊙ pc−2. Accounting for normalization uncertainties – including different lensing magnification scenarios for the arc – a modified SCMF, combined with a significantly high star cluster formation efficiency (approaching 100%), appears to be a necessary condition to explain the relatively short formation timescale of both the star clusters and the counter image, without exceeding the galaxy’s stellar mass. By extrapolating the physical properties at the peak of the burst, we found that in its recent past (≲30 Myr) the Cosmic Gems galaxy likely experienced a specific star formation rate exceeding 25 Gyr−1 and luminosity approaching the “blue monster” regime (MUV < −20). Our study provides insights into the extreme clustered nature of star formation in early galaxies and sheds light on the formation of bound star clusters that might survive to z = 0 as globular clusters older than 13 Gyr.
Key words: galaxies: distances and redshifts / galaxies: formation / galaxies: high-redshift / galaxies: star formation
Based on observations collected with the James Webb Space Telescope (JWST) and Hubble Space Telescope (HST). These observations are associated with JWST program n.4212 (PI L. Bradley) and program n. 5917 (PI E. Vanzella).
© The Authors 2026
 Open Access article, published by EDP Sciences, under the terms of the Creative Commons Attribution License (https://creativecommons.org/licenses/by/4.0), which permits unrestricted use, distribution, and reproduction in any medium, provided the original work is properly cited.
This article is published in open access under the Subscribe to Open model. This email address is being protected from spambots. You need JavaScript enabled to view it. to support open access publication.
1. Introduction
In the local Universe, star formation is hierarchically organized in star clusters. Bound star clusters represent only a fraction of the total stellar mass formed in a given time, a measure typically referred to as cluster formation efficiency, Γ (e.g., Krumholz et al. 2019). Bound star cluster populations follow a power-law distribution of their masses and possibly show a cutoff at the high-mass end, describing the maximum star cluster mass a galaxy might form (Adamo et al. 2020a). The quantity Γ has been extensively measured in the local Universe and found to positively correlate with the star formation rate (SFR) surface density (ΣSFR) of the main galaxy (e.g., Adamo et al. 2015; Johnson et al. 2016; Messa et al. 2018), although it remains difficult to disentangle the biases in the methodology leading to contrasting results (Cook et al. 2023). The observed increase of a galaxy’s ΣSFR with redshift (e.g., Ormerod et al. 2024; Morishita et al. 2024) suggests that Γ was high in the early Universe. However, a direct measure of Γ at cosmological distances is extremely challenging and will require extreme adaptive optics with point spread function (PSF) sizes of ≃10 − 20 milliarcsec from the extremely large telescope or next-generation instruments on 8m class telescopes coupled with gravitational lensing (see the discussion in Vanzella et al. 2022). First attempts of measuring Γ at high redshift come from exceptionally magnified systems (e.g., Vanzella et al. 2020). Several star clusters have been identified in these systems and related to the bursty star formation events in the host galaxy (some have even had their contribution to the total ultraviolet light of the host quantified, Vanzella et al. 2023; Adamo et al. 2024; Messa et al. 2025a; Mowla et al. 2024; Bradač et al. 2024; Fujimoto et al. 2025). Another aspect suggesting a high occurrence of bound star clusters in the early Universe is that high-density conditions on average favor a high Γ, along with the presence of very massive star clusters (e.g., Garcia et al. 2023; Sugimura et al. 2024; Kruijssen 2026).
High redshift star clusters were already identified in the pre-JWST era with Hubble (e.g., Vanzella et al. 2017a,b, 2019, 2022), along with several parsec-scale star complexes (e.g., Bouwens et al. 2017; Rigby et al. 2017; Johnson et al. 2017; Meštrić et al. 2022; Welch et al. 2023). The advent of JWST has enabled the identification of similar parsec-scale stellar clump regions with lower magnifications and/or higher redshift (e.g., Messa et al. 2025a; Claeyssens et al. 2025; Vanzella et al. 2023; Mowla et al. 2024; Hsiao et al. 2023; Fujimoto et al. 2025), and it has even allowed for detection of relatively old star clusters by means of its extended (NIRCam and MIRI) wavelength range (e.g., Adamo et al. 2023).
Remarkably, the discovery of the super magnified Cosmic Gems (CG) arc (Bradley et al. 2025, hereafter LB25), now spectroscopically confirmed to be at redshift 9.625 (Messa et al. 2025b, MM25 in the following) is the first concrete opportunity we have of addressing the internal properties of a galaxy within the first 500 Myr of cosmic time. Furthermore, the recent identification of five very dense (∼105 − 6 M⊙ pc−2) and massive (∼[1 − 3]×106 M⊙) gravitationally bound star clusters all located within a relatively small physical region of ∼70 pc in the CG galaxy was unexpected (Adamo et al. 2024, hereafter AA24), and to our knowledge, it has no analogous example in the local Universe.
In this work we infer the fraction of stellar mass of the CG galaxy that formed in bound stellar clusters. We explore the amount of stellar mass located in star clusters by properly integrating the star cluster mass function (SCMF; after varying the slope and the minimum cluster mass) and compare it with the physical properties and stellar mass of the entire galaxy, inferred from JWST/NIRCam photometric data of the candidate counter image (CI) which offers the best representation of the global properties of the CG galaxy.
Throughout this paper, we assume a flat cosmology with ΩM = 0.31, ΩΛ = 0.69, and H0 = 67.7 km s−1 Mpc−1 (Planck Collaboration LIV 2018), corresponding to 4360 parsecs per arcsecond at z = 9.625. All magnitudes are given in the AB system (Oke & Gunn 1983): mAB = 23.9 − 2.5log(fν/μJy).
2. The Cosmic Gems galaxy
2.1. Star clusters and lensing magnification
Initially discovered in the Hubble data from the RELICS survey (Coe et al. 2019, see also Welch et al. 2023), the CG arc shows (at least) five gravitationally bound parsec-scale star clusters in JWST/NIRCam imaging. These clusters have recently been confirmed (after spectroscopic redshift determination) to be remarkably dense (∼105 − 6 M⊙ pc−2) and massive (∼[1 − 6]×106 M⊙) and have ages spanning the range 8 − 27 Myr (MM25), and they are likely located within a magnified portion of the CG galaxy smaller than 70 parsecs (AA24). The initial lens models of the galaxy cluster SPT0615 (Adamo et al. 2024; Bradley et al. 2025) were recently refined by including additional new multiple systems at 2 < z < 6 from VLT/MUSE (PI. Bauer), confirming the critical line crossing the arc and very large magnification factors along the arc (μ > ×50 − 300; MM25). The improved models also confirm the previous predictions of the position of a CI, which was later detected in the NIRCam images (with S/N ≃ 15), showing the same colors and a very solid photometric redshift compatible with the main arc (LB25, and see Fig. 1 and Fig. 2). The angular separation between the improved lens model predictions and the candidate CI are ≲1″. No other z ∼ 10 candidates have been detected (at the available depth) within a region of 10″ centered on the predicted positions. We consider this CI as the best proxy of the entire CG galaxy. Such an image is far from any z = 9.625 critical lines and lies within a few (or fraction of) arc seconds from the predicted positions of the current best models (MM25). The low magnification and small error, μhost = 1.84 ± 0.05, associated with the CI allow us to derive the global physical properties of the CG galaxy with low lensing-related uncertainty dependence. The very low magnification, however, prevents us from identifying the massive star clusters that we detect in the arc.
 |
Fig. 1. JWST/NIRCam color image of the portion of the galaxy cluster SPT0615 field including the CG arc and the CI (white circles) along with the critical lines at the z = 9.625 for LENSTOOL (Jullo et al. 2007) and GLAFIC (Oguri 2010, 2021) lens models, marked with red and green lines, respectively. The yellow shaded square marks the field of view of the JWST/NIRSpec IFU observations (see Messa et al. 2025b). |
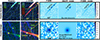 |
Fig. 2. JWST/NIRCam imaging and Galfit fitting of the CG arc and its CI. The left panels show the sharp dropout of the arc and CI in the Hubble (F435W+F606+F814W, blue channel) and JWST/NIRCam (F090W+F115W, green channel) RGB rendering, with the detection in the redder JWST/NIRCam bands (red channel of the RGB rendering, as indicated in the figure). In the color image showing the CI, the predicted position from the new Glafic (yellow star) and LENSTOOL (green star) models are reported (from MM25). The regions outlined with yellow squares are zoomed in on in the right panels (in NIRCam F150W), and we include the Galfit modeling and residuals (in counts units, rightmost panels). |
In the following analysis, we adopt the updated lensing model predictions for both the CI, μhost as reported above, and the star clusters, using the updated μarc from MM25 (reported in Appendix A), which closely resemble those published by AA24. Further considerations on how the change in the predicted magnifications affects our results are presented in Appendix A.
2.2. Physical properties and morphology of the host galaxy
The authors of MM25 derived the physical properties of the CG arc by performing JWST/NIRSpec-IFU-based spectral and spectral energy distribution (SED) fitting across subregions of the arc. The sum of the intrinsic stellar masses inferred for each region yielded an estimate of the galaxy’s stellar mass, ≈3.5 × 10⁷ M⊙. This value is consistent with that derived from the CI (see below), as are the inferred stellar age (10 − 40 Myr) and low dust attenuation (AV ≲ 0.2). Combined with the weak rest-frame optical lines detected in the NIRSpec/IFU datacube – namely, Hβ and [O III]λ49591 (4960.30 Å, vacuum), with equivalent widths of ≃20 Å and ≃50 Å, respectively – the galaxy currently appears to be in a “dormant” phase of star formation. As noted by MM25 and analyzed in detail by Christensen et al. (in prep.), the NIRSpec spectrum exhibits a pronounced Lyα damping wing that depresses the F150W flux, especially in the arc and its CI (showing relatively high signal-to-noise ratios on NIRCam data). This flux deficit likely caused the previously overestimated photometric redshifts (zphot > 10) for both images, compared to the new spectroscopic value zspec = 9.625. The authors of MM25 also reported revised physical properties of the star clusters using the photometry extracted by AA24, assuming star formation histories of τ = 1 Myr using the Binary Population and Spectral Synthesis (BPASS) models and updating the redshift to the new value. Stellar masses in the range (1 − 6)×106 M⊙ and ages 8 − 27 Myr were found and agree within the uncertainties with the previous estimates by AA24.
Based on the JWST/NIRCam photometry presented in LB25 (from their Table 3) and adopting the new spectroscopic redshift z = 9.625, we performed a new SED analysis of the CI with Bagpipes (Carnall et al. 2019). Following the analysis of MM25, we used BPASS v2.2.1 templates (Eldridge et al. 2017), Kroupa (2002) the stellar initial mass function (IMF), delayed-τ star formation history (SFH), and the dust attenuation curve of Calzetti et al. (2000). Driven by the new spectroscopic constraints and the discussion in MM25, we assumed that the CI is not younger than the hosted clusters (> 10 Myr). We also explored the effect of the Lyα-damping (Christensen et al., in prep.) on the inferred physical properties by including and excluding the F150W band from the fitting (the best-fit results do not change the conclusions of this work; see Appendix B). The inferred fiducial physical quantities and uncertainties are reported in Fig. 3.
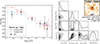 |
Fig. 3. Corner plot (right) and SED fitting results of the CI (left). We fixed z = 9.625 throughout and adopted an age not younger than 10 Myr (see text for more details). Red and blue lines on the left indicate fits respectively excluding or including the F150W data point. The red line shows the fiducial SED fit solution (see Fig. B.1 for a comparison of corner plots with and without the F150W band data point). Horizontal bars indicate the bandwidth. In the right panel, the inset shows the stacked short wavelength bands (F150W + F200W) image of the CI, where the 2σ contour is outlined. The blue and red stars in the corner plot mark the best and median solutions. The same is indicated with the vertical blue line (best solution) and the dotted and dashed red lines (median and 16−84% percentiles). The mass-weighted age and the current stellar mass are reported. |
The intrinsic stellar mass (corrected for μhost) of the CG galaxy – derived from the CI – is mCG = 3.5 × 10⁷ M⊙, with a 68% central interval (1.7 − 6.9)×107 M⊙ and a mass-weighted age of 13 (9 − 25) Myr. Within the uncertainties, the stellar mass is in agreement with the values inferred from the arc (2.5 − 5.6)×107 M⊙ reported by LB25, which, however, assumed the previous z = 10.2 photometric redshift. It is important to note that the mass of the arc from LB25 has been corrected by a median magnification value, but the magnification gradients across the system are severe. Thus, the agreement between the two mass estimates (the arc and the CI) gives us confidence that the CG mass is close to this value. The age recovered for the CI agrees with the age ranges obtained for the star clusters (between 8 and 28 Myr, MM25). Overall, the formation age of the CG galaxy is likely not older than 30 Myr, and it mainly refers to the age of the recent burst of star formation (see also discussion in Sect. 4 about uncertainties related to the SFH).
Figure 2 shows the Galfit modeling (Peng et al. 2010) of the CI detected at S/N ≃ 15 in the NIRCam F150W band, the one with the sharpest PSF ( ). The galaxy appears resolved and nucleated, with an effective radius of
  pixels (1 pixel =
  ) and magnitude 28.5 ± 0.2 (in agreement with LB25). We fixed the Sersic index to n = 1.0, but highlight that similar results are obtained when adopting a Gaussian (n = 0.5) profile. As reported in Fig. 2, the Galfit modeling produces an excellent residual map (reduced χ2 = 0.63). The intrinsic effective radius
 ![Mathematical equation: $ R_{\mathrm{eff}} = 1.6\,\mathrm{[pix]} \cdot 0.02{{\prime\prime}}\cdot 4360 [\mathrm{pc}/{{\prime\prime}}]/\mu_{\mathrm{host}}^{-0.5} = 103_{-15}^{+13} $](/articles/aa/full_html/2026/01/aa56570-25/aa56570-25-eq7.gif) parsecs implies
parsecs implies  M⊙ pc−2 (or 5.3 × 10⁸ M⊙ kpc−2), where the errors account for Reff, μhost and mass uncertainties. Similarly, adopting a constant SFR over the past 20 Myr, the ΣSFR is
  M⊙ yr−1 kpc−2. The stellar mass and size of the CI is comparable with those inferred at a similar redshift and luminosity (Morishita et al. 2024; Ono et al. 2023; Tang et al. 2023). Despite taking into account the area underlined by a two-sigma contour in the F150W+F200W image (see Fig. 3, corresponding to 0.141 kpc−2 in the source plane), the above quantities ΣSFR and Σmass still remain quite large: 8 M⊙ yr−1 kpc−2 and 229 M⊙ pc−2, respectively. Interestingly, the high stellar mass surface density (Σmass) inferred here is comparable to that observed in compact galaxies at z ≳ 10, including the recently discovered z = 14.44 MoM-z14 (Naidu et al. 2025), one of the most nitrogen-enhanced sources identified with JWST ([N/C]> 1). In an emerging picture suggesting a size–chemistry bimodality at z > 10, where extended systems tend to be nitrogen-poor but compact galaxies exhibit strong nitrogen emission (e.g., Naidu et al. 2025; Ji et al. 2025), the CG galaxy appears to share the same stellar density and morphology as the nitrogen-rich class, which is reminiscent of similarly dense and massive star clusters discovered at lower redshift, such as the Sunburst at z = 2.37 (Meštrić et al. 2023; Schaerer et al. 2024). It is also worth mentioning that the large specific SFR (sSFR) of the CG galaxy experienced in the past (up to 100 Gyr−1; see Sect. 4) also favors an N-enhancement scenario (Topping et al. 2025). It could likely be observed during its “off-mode” star formation, when most of its stellar mass is already assembled in bound clusters, consistent with a globular cluster-like environment.
The SFR inferred above for the CG galaxy under the assumption of constant star formation yields a lower limit on ΣSFR that already exceeds values typical of local galaxies (at least under the current constraints that we have). This implies a phase shorter than ∼20 Myr during which the ΣSFR was higher than the estimate above; this is likely linked to efficient star cluster formation. This conclusion follows from comparisons with local star forming galaxies showing log(ΣSFR) > 0, which are generally associated with star cluster formation efficiencies Γ ≳ 50% (Adamo et al. 2020b), measured over comparable timescales (10−20 Myr). However, it is important to stress that in local galaxies, the mass in star clusters is insignificant with respect to the total mass of the galaxy. This is not the case in such galaxies as the CG. It is also worth noting that the formation of five massive star clusters in the last 30 Myr is remarkable in such a low-mass galaxy. As a reference, for typically observed conditions in the local Universe, the minimum total stellar mass a galaxy needs to form in order to sample one 106 M⊙ cluster is ≃5 × 10⁷ M⊙ (e.g., Elmegreen et al. 2012; Elmegreen & Elmegreen 2017), which is the same amount inferred in the CG galaxy. The presence of five such massive clusters in the CG galaxy is statistically unexpected and therefore poses an interesting question on the possible large mass fraction in star clusters in this early galaxy. This question is addressed in the next section.
3. A preponderance of stellar clusters in the Cosmic Gems arc
The quantity Γ reflects the clustering in space and time of the star formation process, which spreads the stellar mass into many individual clusters with a mass distribution often expressed as a power-law slope of −2 (for linear intervals of mass) and an exponential drop at some high cluster mass, Mc (Elmegreen et al. 2012; Adamo et al. 2020a). Depending on the environmental conditions, Mc can be as high as 107 M⊙ (Adamo et al. 2020b), and the SCMF is essentially a power law up to the most massive star cluster formed (Elmegreen & Elmegreen 2017). In this analysis we test different assumptions for Γ as described below.
For the sampling of the cluster mass function, we adopted the functional form dn(M)/dM = n0Mβ; assumed three slopes, namely β ≃ −1.5, −2.0, and −2.5; and integrated down to three different (low) mass limits, Mlim = 102, 103.5, and 105 M⊙. We first determined the fraction of stellar mass residing in star clusters with respect to the stellar mass of the CG galaxy, using the reported masses of the five star clusters from MM25. This estimate was obtained as follows: the sum of the mass in the five massive star clusters was used to normalize the mass distribution of the entire star cluster population, which is integrated down to a given Mlim (Elmegreen & Elmegreen 2017). In particular, considering the best delensed estimates of the stellar masses of the five star clusters (6.02, 2.24, 1.05, 0.78, 0.93 × 10⁶ M⊙ for clusters A, B, C, D, and E, respectively indicated in Fig. 2) and integrating the SCMF down to Mlim = 102 M⊙ with β = −2, we obtained a total mass in clusters (5.9 × 10⁷ M⊙) that is 1.68 times higher than the intrinsic mass of the CI (3.5 × 10⁷ M⊙). This simple calculation already suggests that the CG galaxy formed a population of star clusters – including massive ones – very efficiently and in a way that must be consistent with the total stellar mass of the burst that produced them. However, the calculation must incorporate the uncertainties in the observed cluster masses. We accounted for these uncertainties by propagating them via Monte Carlo sampling, as described below.
3.1. The fraction of star cluster mass in the Cosmic Gems galaxy
The normalization of the SCMF depends on the lens model magnification of each star cluster. In the following, we report the results adopting the updated fiducial values of magnification for each star cluster and μhost = 1.84 ± 0.05 (the effect of different magnifications is shown in Appendix A). We include the uncertainty of the stellar masses through a Monte Carlo process, which extracts 1000 realizations of the five star cluster masses drawn from distributions following their uncertainties. For each set of masses (realization), we have the minimum (mmin), maximum (mmax), and the sum of the masses of the actual set of five clusters (Sclusters). The normalization of the SCMF was properly calculated at each Monte Carlo realization by requiring the integrated portion of the SCMF between mmin and mmax be Sclusters (the same results can be obtained if we consider the number of clusters in place of integrated mass).
Once the normalization was calculated at the given Monte Carlo extraction, the inferred stellar mass of the full star cluster population ( ) integrated in the mass range Mlim to mmax was compared to the delensed stellar mass of the CG galaxy, mCG (inferred from the CI, including its uncertainties on the mass and μhost). The term Mlim is the adopted minimum cluster stellar mass. The resulting mass fraction (
 ) of the stellar mass located in the star cluster population calculated adopting the fiducial magnification case and varying the slope of the mass function (β = −1.5, −2.0, and −2.5) and the Mlim is shown in Fig. 4 (the behavior as a function of the magnification is discussed in Appendix A). Depending on the assumptions, the distributions in the figure show that the stellar mass of the CG galaxy cannot indiscriminately accommodate all the solutions. The galaxy does not have enough stellar mass to accommodate a cluster population with a SCMF of slopes −2.5 even when a very high Mlim is used (nearly all realizations exceed the mass of the host galaxy). On the other hand, a top-heavy SCMF with a slope of −2.0 < β < −1.5 and an increasingly high Mlim produces mass fractions peaked at 100%; that is, it is more likely that the galaxy has sufficient mass to accommodate a cluster population even if there is still a large fraction of the host mass located in star clusters. In general, if the SCMF is sampled down to a mass limit of 104 M⊙ or lower, it is more likely that it is top-heavy. If we look at the mass fraction as a measurement of Γ, this exercise implies that cluster formation efficiency is very high and almost reaches unity, as the full mass of the galaxy is nearly located in the star clusters. While it has been argued that the IMF may turn top-heavy at high redshift and/or low metallicity (e.g., Chon et al. 2021; Steinhardt et al. 2023; Meena et al. 2025), adopting a top-heavy IMF for the CG galaxy is unlikely to challenge these conclusions. If the actual IMF indeed features a flatter slope than the standard IMF or an extension to much higher stellar masses, then an analysis based on the standard IMF could cause the total stellar masses of young stellar systems to be overestimated. However, since the CG star clusters and the CI display similar SED shapes (and consequently similar estimated ages), such putative mass offsets are likely to be similar in the star clusters and the overall galaxy, thereby canceling out any significant effect on the inferred mass fraction of the clusters.
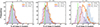 |
Fig. 4. Monte Carlo realizations of the fraction of the stellar mass of the CG galaxy residing in the population of bound star clusters. The uncertainties on the normalization of the SCMF and the stellar mass of the host galaxy are included (see the text for details). From left to right, the SCMF is evaluated for slopes β of −1.5, −2.0, and −2.5 by adopting three different low-mass limits, as indicated in the legend of each panel. Calculations have been performed assuming the fiducial magnification values (while the behavior with varying magnification is shown in Fig. A.1). The vertical line bar marks the case where the total stellar mass of the star clusters equals that of the host galaxy (fraction equal to 100%). |
3.2. Stochastic sampling of the star cluster mass function
In this section we derive the likelihood of forming at least five massive star clusters with masses > 106 M⊙ assuming a fraction of the galaxy mass,  , is in bound star clusters. We adopted mCG = 3.5 × 10⁷ M⊙ (the stellar mass of the host galaxy, Sect. 2.2) and Γ = 1.0 (100%, the full galaxy mass) and Γ = 0.5 (50%, half of the galaxy mass). The random sampling of the SCMF was performed assuming slopes, β, from −2.5 to −1.5 (with steps of 0.25) and a low-mass limit (Mlim) from 102 M⊙ to 105 M⊙. The higher-mass end of the distribution, i.e., the maximum cluster mass, was chosen as half of the available galaxy mass in clusters (0.5 ⋅ mCG ⋅ Γ). One thousand realizations have been performed for each combination of parameters. For each realization, the process stochastically generates a synthetic population of star clusters that obeys the aforementioned set of parameters. In particular, the specific masses of individual clusters and the number of clusters vary from run to run (since high-mass clusters are rare, they “use up” more of the total budget), and the presence or absence of massive outliers depends on chance (especially near the maximum cluster mass).
The resulting probabilities of forming at least five massive star clusters (mass > 106 M⊙) are shown in Fig. 5. Consistent with the results discussed in the previous section, a top-heavy SCMF with a slope shallower than −2 (−1.8, −1.5) and/or a higher minimum cluster mass limit (Mlim) is clearly preferred. Only maximizing Γ to 100% and pushing the low-mass limit of the mass function to higher values does allow for reasonable solutions (i.e. probabilities ≫1%) in case of slopes close to −2. In general, solutions with slopes steeper than −2 have a very low (≲1%) likelihood under all assumptions.
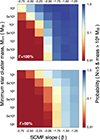 |
Fig. 5. Statistical sampling of the SCMF. The color coded probability of having five or more massive star clusters (with masses exceeding 106 M⊙) is shown as a function of the slope of the stellar cluster mass function (SCMF, β) and the low-mass limit used to integrate the SCMF. The top panel presents the scenario where the entire mass of the CG galaxy is composed of stellar clusters (Γ = 100%), while the bottom panel illustrates the case with Γ = 50%. |
These results are, to some extent, dependent on the effective resolution and our ability to identify individual massive clusters. Although it is unlikely that parsec-scale objects are composed of unresolved subcomponents (i.e., lower-mass star clusters), it is worth noting that the same result is obtained even when the cluster masses are halved and their number doubled. Finally, shallow slopes of the SCMF (−1.5 or −1.25) might overproduce the number of massive star clusters relative to the observed population (i.e., those with masses above 106 M⊙) and rapidly saturate the fraction of the CG stellar mass assumed to reside in star clusters. This results in an overall lower probability of finding at least five massive clusters at small values of Γ, as illustrated in Fig. 5 by comparing the top and bottom panels. Even in the case of Γ = 100% (i.e., 3.5 × 10⁷ M⊙ resides in star clusters) – the most favorable scenario for forming massive clusters – the expected number of massive clusters for a top-heavy SCMF rarely exceeds ten, with the probability of having at least ten clusters more massive than 106 M⊙ remaining below 5%. Finally, we verified that the results remain unchanged when adopting a Schechter formalism with M★ equal to the cluster mass cutoff described above, 0.5 ⋅ mCG ⋅ Γ, and the same slope on the power-law side.
The observed massive star clusters in the CG arc can be attributed to a combination of factors, including a top-heavy SCMF combined with a high fraction of the host galaxy’s star formation occurring in bound star clusters (high Γ), and/or the suppression of star cluster formation at the low-mass end. Various feedback mechanisms, such as radiation, supernovae, winds, and Lyman-alpha (Lyα) pressure, influence the initial shape of the SCMF (Andersson et al. 2024; Nebrin et al. 2025), which is ultimately connected to the IMF within clusters (Elmegreen 2006; Krumholz et al. 2019). These physical mechanisms can affect the shape of the SCMF, but high-resolution simulations of low-metallicity star cluster formation that include these physics are, for the most part, still missing.
Using a cosmological zoom simulation, Sugimura et al. (2024) found that the formation of massive bound star clusters and the extreme burstiness observed in several high-z galaxies is mainly produced by the effect of strong Lyman-Warner radiation (far-UV) from Pop II stars in a low-metallicity environment. This radiation leads to a hot interstellar medium through suppression of H2 formation and cooling, thus increasing the Jeans mass and the typical masses of star forming clouds. As shown in Garcia et al. (2023, 2025), this mechanism leads to a flattening of the SCMF rather than an increase of the low-mass cutoff of the mass function. The properties of the compact star clusters in these simulations are in good agreement with those found in the CG; however, there are some caveats. The galaxies simulated by Garcia et al. (2025) and Sugimura et al. (2024) have a relatively low mass and low metallicity with respect to the CG (Messa et al. 2025a). In more massive galaxies, when invoking simple scaling arguments, we may expect stronger bursts of star formation and more massive gas clouds for a given power-law slope of the SCMF. These scaling relations may balance out the effect of increased gas metallicity, but more simulations of higher-mass galaxies need to be run to confirm this hypothesis. In addition, it is also possible that some physical ingredients are still missing in these simulations that may further increase the Jeans mass in the interstellar medium even at higher metallicities, for instance heating from cosmic rays and X-rays from binary stars, accreting intermediate-mass black holes, or micro-active galactic nuclei.
The conditions for star formation in these high-redshift compact galaxies (the five clusters are located in a region spanning about 70 pc, while from the CI we derived a very small size for the entire galaxy) drive very high star formation surface densities that in turn contribute to elevated Γ values (Adamo et al. 2020b; Li et al. 2018). Recently, Lyα feedback has been proposed as a dominant process that might suppress the formation of low-mass star clusters (Nebrin et al. 2025). Despite the very high lensing magnification factors, completeness limitations related to resolution and depth hinder the ability to count or disentangle individual star clusters down to low masses (103 − 104 M⊙). The lack of detection of low-mass clusters in the CG arc might imply that they have been suppressed. However, we cannot exclude incompleteness. These limitations will be addressed in a forthcoming study that will employ forward modeling simulations incorporating lensing uncertainties. Assuming a slope of β = −2, in line with the observed local values for young starbursts (≲50 Myr; e.g., Whitmore et al. 2010; Linden et al. 2021; Adamo et al. 2020b) and with those derived from simulations (Calura et al. 2025; Pascale et al. 2025; He et al. 2020; Krumholz et al. 2019), our results suggest that large Γ values are preferred in the CG galaxy along with a higher low-mass limit.
4. Star formation history
The observed magnitude of the CI in the F200W filter is 28.4 ± 0.1 (LB25), corresponding to an intrinsic magnitude of 29.1 ± 0.1 after accounting for the lensing magnification factor, μ = 1.84. This translates to an absolute UV magnitude of  at the rest-frame λ ≃ 1800 Å. This value is about four times fainter than the “blue monster” regime of the recently identified class of bright galaxies at z > 9 showing MUV ≲ −20 (Whitler et al. 2025; Napolitano et al. 2025; Finkelstein et al. 2024; McLeod et al. 2024; Castellano et al. 2023; Donnan et al. 2024, 2025; Harikane et al. 2023, 2024; Pérez-González et al. 2023; Tang et al. 2025).
We investigated whether the CG galaxy could have experienced such a UV-bright phase in the past. The typical and fundamental source of uncertainty regarding the SFH arises from the spatially unresolved formation histories of the internal regions, which contribute collectively to the observed integrated light. In addition, the absence of rest-frame optical coverage also prevents us from deriving any solid conclusion about the presence of old (≳100 Myr, or z > 11.4 in the present case) stellar populations and limits us to inferring an ultraviolet–B-band-based SFH. This limitation also applies to the CI discussed here. However, the strongly magnified arc offers critical insight into the formation histories of individual subcomponents of the galaxy. The ages of the individual star clusters span a time interval consistent with the formation timescale inferred from the CI (9 − 27 Myr; Fig. 3). In particular, four of the five clusters formed between 8 and 15 Myr ago (A, B, C, D), while the remaining cluster (E) dates back to approximately 27 Myr ago (MM25). Such a post-burst mode of the CG galaxy is also corroborated by weak optical emission lines observed in new spectroscopic JWST/NIRSpec observations (MM25). With a total intrinsic stellar mass of ≃1.1 × 10⁷ M⊙ located in clusters A−E, formed during an interval of time ∼20 Myr, the resulting minimum sSFR is ≃50 Gyr−1 (when adopting a constant SFR). If we assume the last burst made the bulk of the mass that we inferred from the SED fitting (3.5 × 10⁷ M⊙; see Fig. 3), then the CG galaxy was very active in forming stars in the recent past (≳10 Myr ago) and likely appeared brighter in the ultraviolet than observed now.
This aligns with the relatively short formation timescale inferred from the SED fitting, which describes the dominant UV-weighted mass assembly of the CG galaxy. Figure 6 (top panels) shows the fiducial SFHs obtained by the SED fit for the CI (left) and for the sum of each individual star cluster (right). Rather than the CI, we focus on the star clusters, which more directly trace the most recent burst of star formation.
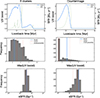 |
Fig. 6. Inferred past star formation activity for the five star clusters (left panels) and for the CI (right panels). From top to bottom, the best-fit solutions of the UV boosting factor (blue curve) and SFR (green curve); Monte Carlo distribution of the maximum boosting factor with median, percentiles, and fiducial values (see the text for details); Monte Carlo distribution of the sSFR (median, percentiles, and fiducial values follow the same color coding as in the middle panels). |
Two main effects drive the recent luminosity history of the CG galaxy: (1) stellar aging and (2) dust extinction. To assess the ultraviolet luminosity of the CG, we traced back the SFH of each cluster using BPASS models to determine their age and mass at each timestep2 and consequently the UV luminosity. The sum of these luminosities, compared to the observed one, gave the UV boosting factor (Fig. 6, top). In order to assess the uncertainties, we ran 1000 Monte Carlo realizations, and in each realization, we randomly drew the properties of each star cluster (most relevantly, age and mass) from the posterior distribution used to derive its best-fit properties in MM25 (see their Table 2). We then repeated the process for finding the evolution of the ultraviolet boosting factors and in particular of the maximum boost reached in each realization, whose distribution is shown Fig. 6 (central). The median maximum boosting factor we obtained is 3.1, with 16th and 84th percentiles of 1.9 and 4.5. In magnitudes, the median brightening from aging alone is therefore −1.23, occurring ≃15 Myr ago.
The current photometric, AV, estimates for the five clusters span ≃0.2 − 0.4, while the host galaxy has AV ≃ 0.23 (MM25), within 1σ uncertainty of AV inferred from the CI. When adopting AV ≃ 0.2, the corresponding A1800 is ≃0.5 mag, computed from A1800 = AVk(1800)/Rv using the Calzetti law (k(1800)≈9.4, RV = 4.05). Assuming the same attenuation for the host galaxy, the dust-free MUV of the CI is −18.9 (from the observed −18.4 corrected by 0.5 mag). Therefore, in the absence of dust attenuation and accounting for aging alone, the CI was intrinsically brighter than MUV = −20 in 57% of the Monte Carlo realizations.
The key question is whether there existed a phase in which dust attenuation decreased sufficiently to resemble a blue monster episode (i.e., high sSFR, very blue UV slope, UV bright). The time evolution of A1800 is not directly measurable and must be modeled.
We measured the sSFR of the system as the inverse of the timescale needed to form its total mass3; the values found are conservative estimates for the average sSFR during the entire SFR event, but larger values could have been reached in the case of a bursty SFH. Also in this case, the posterior distributions from the SED fit were used to estimate uncertainties (Fig. 6, bottom panels). The UV magnitude of the CG galaxy might have experienced significant enhancement in the past, associated with periods of peaked sSFR. The data suggest that in more than 55% of the cases, the sSFR exceeded 25 Gyr−1 during the last burst, with values reaching 100 Gyr−1 (Fig. 6). This value meets the critical threshold of 25 Gyr−1 proposed by Fiore et al. (2023; see also Ferrara et al. 2023) as the condition for the onset of radiation-driven outflows, which has been suggested (among other mechanisms; e.g., Finkelstein et al. 2024) to explain the overabundance of bright blue galaxies observed at z > 9. In particular, in this scenario outflows develop when a galaxy experiences a super-Eddington phase boosted by stellar radiation in compact and dusty galaxies. Recently, Nakazato & Ferrara (2024) studied 20 galaxies at z > 10 and investigated if they experienced a dusty outflow phase in their recent past. The same analysis of Nakazato & Ferrara (2024) applied to the CG galaxy suggests that it was indeed able to develop such a radiation driven outflow about 10 Myr before observations, consistent with the above mentioned sSFR activity and the recent burst traced by the ages of clusters A, B, C, and D about 8 − 15 Myr ago. Based on these tests, the CG galaxy would have appeared as a blue monster had it been observed a few million years earlier, during its bright phase.
The more time-compressed the star cluster formation events are, the greater the resulting boost in both ultraviolet luminosity (modulo dust attenuation) and the galaxy-wide sSFR. At very high redshift, the stochastic nature of star formation further amplifies this UV enhancement. However, this effect alone still appears insufficient to account for the observed overabundance of bright z ∼ 10 galaxies (e.g., Pallottini & Ferrara 2023; Carvajal-Bohorquez et al. 2025).
The high cluster formation efficiency, Γ, measured for the CG galaxy (Sect. 3), combined with its low dust attenuation, also supports the feedback-free scenario proposed by Dekel et al. (2023, see also Williams et al. 2025). In this framework, rapid gas accretion is converted into stars with near-unity efficiency, triggering successive starbursts that enhance the ultraviolet luminosity. The bound stellar remnants from these bursts subsequently appear as massive star clusters.
Ultimately, a combination of the aforementioned mechanisms is likely responsible for shaping the z > 9 ultraviolet luminosity function. Additional spectroscopic observations of CG-like systems are needed to further investigate these scenarios.
5. Final remarks
The CG galaxy is the first example of a z ≃ 10 source in which parsec-scale star formation and individual stellar clusters are probed. We observed five massive star clusters likely formed within the last 30 Myr. We assumed that the SCMF follows a power-law distribution with a given slope. After normalizing the high-mass end to the five massive clusters and assuming a high-mass cutoff (taken as half of the galaxy’s mass), a minimum star cluster mass in the integration (Mlim), and a value for the cluster formation efficiency (Γ), the total stellar mass in clusters exceeds the stellar mass formed during the host galaxy’s most recent burst in several combinations of explored SCMF slopes and Mlim. The results of this exercise suggest that for Γ = 0.5 (and even Γ = 1), a fully populated SCMF with slope β = −2 or steeper and a lower mass cutoff of Mlim < 104 M⊙ is highly unlikely, as it would predict more mass than is actually available from the galaxy’s last burst. Solutions that favor larger values of Mlim may point to two not mutually exclusive effects: (i) The formation of low-mass bound star clusters might be inhibited due to early feedback (e.g., Lyα feedback, Nebrin et al. 2025) and/or (ii) an environmental dependence related to the interstellar medium surface density such that the higher the density, the higher the minimum mass of the bound stellar clusters that reshapes the initial SCMF (e.g., Trujillo-Gomez et al. 2019).
Although it remains to be tested whether by z ≃ 10 sufficient time has elapsed for low-mass clusters to be destroyed by intense stellar feedback, tidal shocks, and other dynamical processes, it is also noteworthy that disrupted clusters would significantly contribute to the total stellar mass of the galaxy. Flatter SCMF slopes than the canonical β = −2 have also been reported in cosmological simulations of galaxies at z > 8. Garcia et al. (2023) found slopes ranging from β ∼ −1.4 to −1.7, with a tendency for the slopes to steepen over time following each starburst episode. After the initial burst of star formation at z > 10, they measured Γ values between 0.5 and 1. More recently, using an improved subgrid prescription incorporating a physically motivated star formation efficiency in star forming gas clouds, Garcia et al. (2025) found even flatter slopes of β ∼ −1.3, in agreement with the findings presented in this paper.
In summary, by analyzing the CG arc and the CI, we found the following:
– Under reasonable assumptions about the shape of the SCMF, in order to reconcile the total stellar mass in the cluster with the stellar mass of the burst in the host galaxy, a top-heavy SCMF with β > −2 and/or a high Mlim are required, along with a large fraction (Γ = 50 − 100%) of the galaxy mass located in star clusters. These results weakly depend on the assumed magnification of the arc. This study represents the first attempt to investigate the properties of the SCMF and formation efficiency at such small spatial scales in the early Universe (first 500 Myr after the Big Bang). The results are based on observations of a single galaxy, and additional statistical samples will be necessary to confirm whether the occurrence of massive star clusters in relatively low-mass galaxies is a common phenomenon at early epochs.
– The CI provides a comprehensive view of the CG galaxy. Based on the SED fitting and Galfit modeling, the stellar mass and effective radius are estimated to be 3.5(1.7 − 6.9)×107 M⊙ and ≃100 pc, respectively, which implies a high stellar surface density of Σmass ≃ 520 M⊙ pc−2. The currently delensed ultraviolet luminosity (MUV = −18.4) and the presence of massive star clusters spanning the age interval 8 − 27 Myr, in which the bulk of hot and massive stars already died (MM25), suggest that this galaxy was more luminous in the past, potentially encompassing the blue monster regime. The detailed star formation history is currently limited by the JWST/NIRCam photometry and NIRSpec spectroscopy probing ultraviolet/B-band rest-frame wavelengths. However, it is worth noting that the more compressed the star cluster formation events are (back in time), the higher the intrinsic luminosity of the galaxy. The best-fit solution from the SED-fitting and spectral analysis by MM25 suggests that the CG galaxy approached MUV ≃ −20 and likely experienced a large sSFR (> 50 Gyr−1).
This is the first evidence that baryon concentration in the early Universe (e.g., Renzini 2025) was highly efficient in forming systems dominated by massive stars, which likely played a pivotal role in driving the ionizing properties of early galaxies as key agents of the reionization process (He et al. 2020). Massive star clusters host (very) massive stars, eventually enhancing both the ionizing photon production efficiency (e.g., Schaerer et al. 2025) and likely the escape fraction of ionizing photons (e.g., Vanzella et al. 2020, 2022; Rivera-Thorsen et al. 2019, 2024).
Future large telescopes working with diffraction limited PSFs of ∼10 milli-arcseconds (e.g., ELT/MORFEO-MICADO, Ciliegi et al. 2024; Sturm et al. 2024) will allow a significant quantum leap to be made when targeting moderately lensed galaxies, as they will enable parsec-scale physical regions (< 10 pc) with modest magnification (μ < 10) to be probed. In fact, a magnification of μ > ×5 is formally sufficient to reach the stellar cluster size regime (see the discussion in Vanzella et al. 2021 on future extreme adaptive optics facilities). Ongoing key JWST massive surveys on lensed fields (e.g., the Vast Exploration for Nascent, Unexplored Sources large program, VENUS, with 300 hours allocated, n.6882 cycle 4, PI Fujimoto) will provide ideal targets for the extremely large telescopes. Observations of the CG arc with a 10 milli-arcsecond PSF resolution will enable sub-parsec light profile analyses at redshift z ≃ 10 along with potentially locating the region hosting the star cluster within the CI.
Acknowledgments
We thank the anonymous referee for helpful comments that improved the manuscript. EV thanks A. Ferrara for very useful discussions on the ‘blue monster’ galaxy population. This work is based on observations made with the NASA/ESA/CSA James Webb Space Telescope and Hubble Space Telescope (HST). The data were obtained from the Mikulski Archive for Space Telescopes at the Space Telescope Science Institute, which is operated by the Association of Universities for Research in Astronomy, Inc., under NASA contract NAS 5-03127 for JWST. These observations are associated with program #4212 (PI L. Bradley) and #5917 (PI E. Vanzella). EV and MM acknowledge financial support through grants PRIN-MIUR 2020SKSTHZ, the INAF GO Grant 2022 “The revolution is around the corner: JWST will probe globular cluster precursors and Population III stellar clusters at cosmic dawn”, and INAF GO Grant 2024 “Mapping Star Cluster Feedback in a Galaxy 450 Myr after the Big Bang”, and by the European Union – NextGenerationEU within PRIN 2022 project n.20229YBSAN – Globular clusters in cosmological simulations and lensed fields: from their birth to the present epoch. AA acknowledges support by the Swedish research council Vetenskapsrådet (VR 2021-05559, and VR consolidator grant 2024-02061). EZ acknowledges project grant 2022-03804 from the Swedish Research Council. This work was supported by JSPS KAKENHI Grant Numbers JP25H00662, JP22K21349 and JP23H00131. J.M.D. acknowledges support from project PID2022-138896NB-C51 (MCIU/AEI/MINECO/FEDER, UE) Ministerio de Ciencia, Investigación y Universidades. F.E.B. acknowledges support from ANID-Chile BASAL CATA FB210003, FONDECYT Regular 1241005, and Millennium Science Initiative, AIM23-0001. AZ acknowledges support by grant 2020750 from the United States-Israel Binational Science Foundation (BSF) and grant 2109066 from the United States National Science Foundation (NSF), and by the Israel Science Foundation Grant No. 864/23. Y.J.-T. acknowledges financial support from the State Agency for Research of the Spanish MCIU through Center of Excellence Severo Ochoa award to the Instituto de Astrofísica de Andalucía CEX2021-001131-S funded by MCIN/AEI/10.13039/501100011033, and from the grant PID2022-136598NB-C32 Estallidos and project ref. AST22-00001-Subp-15 funded by the EU-NextGenerationEU. Additionally, this work made use of the following open-source packages for Python, and we are thankful to the developers of: Matplotlib (Hunter 2007), MPDAF (Piqueras et al. 2019), Numpy (van der Walt et al. 2011), QFitsView DPUSER language (https://www.mpe.mpg.de/~ott/dpuser/index.html).
References
- Adamo, A., Kruijssen, J. M. D., Bastian, N., Silva-Villa, E., & Ryon, J. 2015, MNRAS, 452, 246 [NASA ADS] [CrossRef] [Google Scholar]
- Adamo, A., Zeidler, P., Kruijssen, J. M. D., et al. 2020a, Space Sci. Rev., 216, 69 [Google Scholar]
- Adamo, A., Hollyhead, K., Messa, M., et al. 2020b, MNRAS, 499, 3267 [Google Scholar]
- Adamo, A., Usher, C., Pfeffer, J., & Claeyssens, A. 2023, MNRAS, 525, L6 [NASA ADS] [CrossRef] [Google Scholar]
- Adamo, A., Bradley, L. D., Vanzella, E., et al. 2024, Nature, 632, 513 [NASA ADS] [CrossRef] [Google Scholar]
- Andersson, E. P., Mac Low, M.-M., Agertz, O., Renaud, F., & Li, H. 2024, A&A, 681, A28 [NASA ADS] [CrossRef] [EDP Sciences] [Google Scholar]
- Bouwens, R. J., Illingworth, G. D., Oesch, P. A., et al. 2017, ApJ, 843, 41 [Google Scholar]
- Bradač, M., Strait, V., Mowla, L., et al. 2024, ApJ, 961, L21 [CrossRef] [Google Scholar]
- Bradley, L. D., Adamo, A., Vanzella, E., et al. 2025, ApJ, 991, 32 [Google Scholar]
- Calura, F., Pascale, R., Agertz, O., et al. 2025, A&A, 698, A207 [NASA ADS] [CrossRef] [EDP Sciences] [Google Scholar]
- Calzetti, D., Armus, L., Bohlin, R. C., et al. 2000, ApJ, 533, 682 [NASA ADS] [CrossRef] [Google Scholar]
- Carnall, A. C., Leja, J., Johnson, B. D., et al. 2019, ApJ, 873, 44 [Google Scholar]
- Carvajal-Bohorquez, C., Ciesla, L., Laporte, N., et al. 2025, A&A, 704, A290 [NASA ADS] [CrossRef] [EDP Sciences] [Google Scholar]
- Castellano, M., Fontana, A., Treu, T., et al. 2023, ApJ, 948, L14 [NASA ADS] [CrossRef] [Google Scholar]
- Chon, S., Omukai, K., & Schneider, R. 2021, MNRAS, 508, 4175 [NASA ADS] [CrossRef] [Google Scholar]
- Ciliegi, P., Agapito, G., Aliverti, M., et al. 2024, SPIE Conf. Ser., 13097, 1309722 [Google Scholar]
- Claeyssens, A., Adamo, A., Messa, M., et al. 2025, MNRAS, 537, 2535 [Google Scholar]
- Coe, D., Salmon, B., Bradač, M., et al. 2019, ApJ, 884, 85 [Google Scholar]
- Cook, D. O., Lee, J. C., Adamo, A., et al. 2023, MNRAS, 519, 3749 [CrossRef] [Google Scholar]
- Dekel, A., Sarkar, K. C., Birnboim, Y., Mandelker, N., & Li, Z. 2023, MNRAS, 523, 3201 [NASA ADS] [CrossRef] [Google Scholar]
- Donnan, C. T., McLure, R. J., Dunlop, J. S., et al. 2024, MNRAS, 533, 3222 [NASA ADS] [CrossRef] [Google Scholar]
- Donnan, C. T., Dickinson, M., Taylor, A. J., et al. 2025, ArXiv e-prints [arXiv:2507.10518] [Google Scholar]
- Eldridge, J. J., Stanway, E. R., Xiao, L., et al. 2017, PASA, 34, e058 [Google Scholar]
- Elmegreen, B. G. 2006, ApJ, 648, 572 [Google Scholar]
- Elmegreen, D. M., & Elmegreen, B. G. 2017, ApJ, 851, L44 [Google Scholar]
- Elmegreen, B. G., Malhotra, S., & Rhoads, J. 2012, ApJ, 757, 9 [Google Scholar]
- Ferrara, A., Pallottini, A., & Dayal, P. 2023, MNRAS, 522, 3986 [NASA ADS] [CrossRef] [Google Scholar]
- Finkelstein, S. L., Leung, G. C. K., Bagley, M. B., et al. 2024, ApJ, 969, L2 [NASA ADS] [CrossRef] [Google Scholar]
- Fiore, F., Ferrara, A., Bischetti, M., Feruglio, C., & Travascio, A. 2023, ApJ, 943, L27 [NASA ADS] [CrossRef] [Google Scholar]
- Fujimoto, S., Ouchi, M., Kohno, K., et al. 2025, Nat. Astron., 9, 1553 [Google Scholar]
- Garcia, F. A. B., Ricotti, M., Sugimura, K., & Park, J. 2023, MNRAS, 522, 2495 [NASA ADS] [CrossRef] [Google Scholar]
- Garcia, F. A. B., Ricotti, M., & Sugimura, K. 2025, Open J. Astrophys., 8, 146 [Google Scholar]
- Harikane, Y., Ouchi, M., Oguri, M., et al. 2023, ApJS, 265, 5 [NASA ADS] [CrossRef] [Google Scholar]
- Harikane, Y., Nakajima, K., Ouchi, M., et al. 2024, ApJ, 960, 56 [NASA ADS] [CrossRef] [Google Scholar]
- He, C.-C., Ricotti, M., & Geen, S. 2020, MNRAS, 492, 4858 [Google Scholar]
- Hsiao, T. Y.-Y., Coe, D., Abdurro’uf, et al. 2023, ApJ, 949, L34 [NASA ADS] [CrossRef] [Google Scholar]
- Hunter, J. D. 2007, Comput. Sci. Eng., 9, 90 [NASA ADS] [CrossRef] [Google Scholar]
- Ji, X., Belokurov, V., Maiolino, R., et al. 2025, ArXiv e-prints [arXiv:2505.12505] [Google Scholar]
- Johnson, L. C., Seth, A. C., Dalcanton, J. J., et al. 2016, ApJ, 827, 33 [NASA ADS] [CrossRef] [Google Scholar]
- Johnson, T. L., Rigby, J. R., Sharon, K., et al. 2017, ApJ, 843, L21 [Google Scholar]
- Jullo, E., Kneib, J. P., Limousin, M., et al. 2007, New J. Phys., 9, 447 [Google Scholar]
- Kroupa, P. 2002, Science, 295, 82 [Google Scholar]
- Kruijssen, J. M. D. 2026, Encycl. Astrophys., 4, 500 [Google Scholar]
- Krumholz, M. R., McKee, C. F., & Bland-Hawthorn, J. 2019, ARA&A, 57, 227 [NASA ADS] [CrossRef] [Google Scholar]
- Li, H., Gnedin, O. Y., & Gnedin, N. Y. 2018, ApJ, 861, 107 [Google Scholar]
- Linden, S. T., Evans, A. S., Larson, K., et al. 2021, ApJ, 923, 278 [NASA ADS] [CrossRef] [Google Scholar]
- McLeod, D. J., Donnan, C. T., McLure, R. J., et al. 2024, MNRAS, 527, 5004 [Google Scholar]
- Meena, A. K., Li, S. K., Zitrin, A., et al. 2025, A&A, 699, A299 [NASA ADS] [CrossRef] [EDP Sciences] [Google Scholar]
- Messa, M., Adamo, A., Östlin, G., et al. 2018, MNRAS, 473, 996 [Google Scholar]
- Messa, M., Vanzella, E., Loiacono, F., et al. 2025a, A&A, 694, A59 [NASA ADS] [CrossRef] [EDP Sciences] [Google Scholar]
- Messa, M., Vanzella, E., Loiacono, F., et al. 2025b, https://doi.org/10.1051/0004-6361/202556574 [Google Scholar]
- Meštrić, U., Vanzella, E., Zanella, A., et al. 2022, MNRAS, 516, 3532 [CrossRef] [Google Scholar]
- Meštrić, U., Vanzella, E., Upadhyaya, A., et al. 2023, A&A, 673, A50 [NASA ADS] [CrossRef] [EDP Sciences] [Google Scholar]
- Morishita, T., Stiavelli, M., Chary, R.-R., et al. 2024, ApJ, 963, 9 [NASA ADS] [CrossRef] [Google Scholar]
- Mowla, L., Iyer, K., Asada, Y., et al. 2024, Nature, 636, 332 [Google Scholar]
- Naidu, R. P., Oesch, P. A., Brammer, G., et al. 2025, ArXiv e-prints [arXiv:2505.11263] [Google Scholar]
- Nakazato, Y., & Ferrara, A. 2024, ArXiv e-prints [arXiv:2412.07598] [Google Scholar]
- Napolitano, L., Castellano, M., Pentericci, L., et al. 2025, A&A, 693, A50 [NASA ADS] [CrossRef] [EDP Sciences] [Google Scholar]
- Nebrin, O., Smith, A., Lorinc, K., et al. 2025, MNRAS, 537, 1646 [Google Scholar]
- Oguri, M. 2010, PASJ, 62, 1017 [NASA ADS] [Google Scholar]
- Oguri, M. 2021, PASP, 133, 074504 [NASA ADS] [CrossRef] [Google Scholar]
- Oke, J. B., & Gunn, J. E. 1983, ApJ, 266, 713 [NASA ADS] [CrossRef] [Google Scholar]
- Ono, Y., Harikane, Y., Ouchi, M., et al. 2023, ApJ, 951, 72 [NASA ADS] [CrossRef] [Google Scholar]
- Ormerod, K., Conselice, C. J., Adams, N. J., et al. 2024, MNRAS, 527, 6110 [Google Scholar]
- Pallottini, A., & Ferrara, A. 2023, A&A, 677, L4 [NASA ADS] [CrossRef] [EDP Sciences] [Google Scholar]
- Pascale, R., Calura, F., Vesperini, E., et al. 2025, A&A, 699, A31 [NASA ADS] [CrossRef] [EDP Sciences] [Google Scholar]
- Peng, C. Y., Ho, L. C., Impey, C. D., & Rix, H.-W. 2010, AJ, 139, 2097 [Google Scholar]
- Pérez-González, P. G., Costantin, L., Langeroodi, D., et al. 2023, ApJ, 951, L1 [CrossRef] [Google Scholar]
- Piqueras, L., Conseil, S., Shepherd, M., et al. 2019, ASP Conf. Ser., 521, 545 [Google Scholar]
- Planck Collaboration LIV. 2018, A&A, 619, A94 [NASA ADS] [CrossRef] [EDP Sciences] [Google Scholar]
- Renzini, A. 2025, MNRAS, 536, L8 [Google Scholar]
- Rigby, J. R., Johnson, T. L., Sharon, K., et al. 2017, ApJ, 843, 79 [Google Scholar]
- Rivera-Thorsen, T. E., Dahle, H., Chisholm, J., et al. 2019, Science, 366, 738 [Google Scholar]
- Rivera-Thorsen, T. E., Chisholm, J., Welch, B., et al. 2024, A&A, 690, A269 [NASA ADS] [CrossRef] [EDP Sciences] [Google Scholar]
- Schaerer, D., Marques-Chaves, R., Xiao, M., & Korber, D. 2024, A&A, 687, L11 [NASA ADS] [CrossRef] [EDP Sciences] [Google Scholar]
- Schaerer, D., Guibert, J., Marques-Chaves, R., & Martins, F. 2025, A&A, 693, A271 [NASA ADS] [CrossRef] [EDP Sciences] [Google Scholar]
- Steinhardt, C. L., Kokorev, V., Rusakov, V., Garcia, E., & Sneppen, A. 2023, ApJ, 951, L40 [NASA ADS] [CrossRef] [Google Scholar]
- Sturm, E., Davies, R., Alves, J., et al. 2024, SPIE Conf. Ser., 13096, 1309611 [Google Scholar]
- Sugimura, K., Ricotti, M., Park, J., Garcia, F. A. B., & Yajima, H. 2024, ApJ, 970, 14 [NASA ADS] [CrossRef] [Google Scholar]
- Tang, M., Stark, D. P., Chen, Z., et al. 2023, MNRAS, 526, 1657 [NASA ADS] [CrossRef] [Google Scholar]
- Tang, M., Stark, D. P., Mason, C. A., et al. 2025, ArXiv e-prints [arXiv:2507.08245] [Google Scholar]
- Topping, M. W., Stark, D. P., Senchyna, P., et al. 2025, ApJ, 980, 225 [Google Scholar]
- Trujillo-Gomez, S., Reina-Campos, M., & Kruijssen, J. M. D. 2019, MNRAS, 488, 3972 [NASA ADS] [CrossRef] [Google Scholar]
- van der Walt, S., Colbert, S. C., & Varoquaux, G. 2011, Comput. Sci. Eng., 13, 22 [Google Scholar]
- Vanzella, E., Calura, F., Meneghetti, M., et al. 2017a, MNRAS, 467, 4304 [Google Scholar]
- Vanzella, E., Castellano, M., Meneghetti, M., et al. 2017b, ApJ, 842, 47 [Google Scholar]
- Vanzella, E., Calura, F., Meneghetti, M., et al. 2019, MNRAS, 483, 3618 [Google Scholar]
- Vanzella, E., Caminha, G. B., Calura, F., et al. 2020, MNRAS, 491, 1093 [Google Scholar]
- Vanzella, E., Caminha, G. B., Rosati, P., et al. 2021, A&A, 646, A57 [EDP Sciences] [Google Scholar]
- Vanzella, E., Castellano, M., Bergamini, P., et al. 2022, A&A, 659, A2 [NASA ADS] [CrossRef] [EDP Sciences] [Google Scholar]
- Vanzella, E., Claeyssens, A., Welch, B., et al. 2023, ApJ, 945, 53 [NASA ADS] [CrossRef] [Google Scholar]
- Welch, B., Coe, D., Zitrin, A., et al. 2023, ApJ, 943, 2 [Google Scholar]
- Whitler, L., Stark, D. P., Topping, M. W., et al. 2025, ApJ, 992, 63 [Google Scholar]
- Whitmore, B. C., Chandar, R., Schweizer, F., et al. 2010, AJ, 140, 75 [NASA ADS] [CrossRef] [Google Scholar]
- Williams, C. E., Naoz, S., Lake, W., et al. 2025, ApJ, 990, 135 [Google Scholar]
The other component of the doublet, [O III]λ5007 (5008.24 Å vacuum), is beyond the observed spectral range.
We left all other quantities (i.e., extinction, metallicity, and logU) constant with time.
In the five cluster case, this time is set by the onset of the SFR event for the oldest cluster.
In more detail, 0.5 ≤ k ≤ 2.0 covers the uncertainty range of the reference lens model used in MM25, while k = 3 and 4 are included to consider significant deviation from the best fit lens models.
Appendix A: Varying the magnification of the Cosmic Gems arc
Three lens models were presented in LB25 all yielding comparable magnifications of the arc. MM25 present new models based on additional multiple systems confirmed in the redshift range 1 − 6 with VLT/MUSE spectroscopy (PI. F. Bauer, prog. 0112.A-2069(A)). In this work, we adopt the new fiducial magnification values reported by MM25. The magnifications for the five star clusters including their statistical errors (A, B, C, D, and E) can be written as  , where k = 1.0 corresponds to the fiducial case.
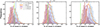 |
Fig. A.1. Fraction of the stellar mass of the CG galaxy residing in the bound star cluster population. The SCMF is integrated down to the minimum stellar mass of 102 M⊙. Each panel presents four histograms, representing the fraction of stellar mass in star clusters calculated using four different sets of magnifications as indicated in the legend (left panel, and see text for more details). The green vertical line indicates the total stellar mass of the host galaxy located in star clusters. |
We then investigated how the results change with variations in V. Figure A.1 presents the same quantities as in Fig. 4, adopting three different sets of V corresponding to k = 0.5, 1.0, 2.0 and 4.0 (half-fiducial, fiducial, double-fiducial and four times fiducial magnifications, respectively). These values were chosen to explore a wide range of uncertainties4 reported in MM25. The magnification gradient along the arc is maintained as suggested by the current fiducial model (MM25), for simplicity. The SCMF is integrated down to a minimum cluster mass of 102 M⊙. The magnification of the CI is fixed to μhost = 1.84 ± 0.05.
Lowering the magnifications below the fiducial values (k < 1) strengthens the conclusions of this work. Specifically, reduced magnifications (e.g., k = 0.5) result in a higher mass fraction residing in clusters for any value of β adopted in the SCMF, often approaching or even exceeding the stellar mass of the CG galaxy. Conversely, significantly higher magnifications (e.g., k = 4.0) would be needed to align the stellar mass of the cluster population with values below that of the host galaxy while keeping more relaxed slope of the SCMF and/or minimum stellar mass and/or Γ. However, it is worth noting that in this case the magnification values are not consistent with any of the lens model predictions described in MM25, and in addition they would imply significantly high stellar mass densities within the star clusters, much higher than those reported by AA24 and MM25. Rather, and more likely, the fiducial magnification values (k = 1) represent the best scenario, which eventually suggest a possible top-heavy shape of the SCMF, and/or an high Mlim, and/or a large Γ in the CG galaxy.
Appendix B: Spectral energy distribution fitting of the counter image
Figure B.1 displays the corner plots from the SED fitting of the CI carried out with and without the JWST/NIRCam F150W band. As shown by MM25 and Christensen et al. in prep., the spectrum exhibits a pronounced Lyα “damping wing" just redward of the line center. The resulting flux depression in F150W is clearly visible in Fig. 3 and matches the deficit measured in the higher–S/N SED of the full arc (LB25). With the spectroscopic redshift now firmly established at zspec = 9.625, we can understand why the original photometric redshifts were over-estimated, zphot = 10.22 ± 0.20 for the arc and  for the CI. The fitting algorithm interpreted the F150W attenuation as the onset of the intergalactic Lyα break sliding into that filter, whereas at z = 9.625 the break lies blueward of F150W and the flux deficit is instead caused by the intrinsic (or local-CGM) damping wing. Including the F150W point in the fit therefore forces the model SED to bend away from an otherwise consistent solution. Because the exclusion of F150W does not change the best-fit stellar mass or age, we omit this band in the final SED fitting to avoid bias from the damping-wing absorption.
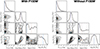 |
Fig. B.1. Corner plots for the CI obtained with and without including the F150W band. Symbols and lines follow the conventions described in Fig. 3. The best-fit parameters remain largely consistent overall; however, differences appear in the posterior distributions of τ and stellar mass distributions (see text for details). |
All Figures
|
Fig. 1. JWST/NIRCam color image of the portion of the galaxy cluster SPT0615 field including the CG arc and the CI (white circles) along with the critical lines at the z = 9.625 for LENSTOOL (Jullo et al. 2007) and GLAFIC (Oguri 2010, 2021) lens models, marked with red and green lines, respectively. The yellow shaded square marks the field of view of the JWST/NIRSpec IFU observations (see Messa et al. 2025b). |
| In the text | |
|
Fig. 2. JWST/NIRCam imaging and Galfit fitting of the CG arc and its CI. The left panels show the sharp dropout of the arc and CI in the Hubble (F435W+F606+F814W, blue channel) and JWST/NIRCam (F090W+F115W, green channel) RGB rendering, with the detection in the redder JWST/NIRCam bands (red channel of the RGB rendering, as indicated in the figure). In the color image showing the CI, the predicted position from the new Glafic (yellow star) and LENSTOOL (green star) models are reported (from MM25). The regions outlined with yellow squares are zoomed in on in the right panels (in NIRCam F150W), and we include the Galfit modeling and residuals (in counts units, rightmost panels). |
| In the text | |
|
Fig. 3. Corner plot (right) and SED fitting results of the CI (left). We fixed z = 9.625 throughout and adopted an age not younger than 10 Myr (see text for more details). Red and blue lines on the left indicate fits respectively excluding or including the F150W data point. The red line shows the fiducial SED fit solution (see Fig. B.1 for a comparison of corner plots with and without the F150W band data point). Horizontal bars indicate the bandwidth. In the right panel, the inset shows the stacked short wavelength bands (F150W + F200W) image of the CI, where the 2σ contour is outlined. The blue and red stars in the corner plot mark the best and median solutions. The same is indicated with the vertical blue line (best solution) and the dotted and dashed red lines (median and 16−84% percentiles). The mass-weighted age and the current stellar mass are reported. |
| In the text | |
|
Fig. 4. Monte Carlo realizations of the fraction of the stellar mass of the CG galaxy residing in the population of bound star clusters. The uncertainties on the normalization of the SCMF and the stellar mass of the host galaxy are included (see the text for details). From left to right, the SCMF is evaluated for slopes β of −1.5, −2.0, and −2.5 by adopting three different low-mass limits, as indicated in the legend of each panel. Calculations have been performed assuming the fiducial magnification values (while the behavior with varying magnification is shown in Fig. A.1). The vertical line bar marks the case where the total stellar mass of the star clusters equals that of the host galaxy (fraction equal to 100%). |
| In the text | |
|
Fig. 5. Statistical sampling of the SCMF. The color coded probability of having five or more massive star clusters (with masses exceeding 106 M⊙) is shown as a function of the slope of the stellar cluster mass function (SCMF, β) and the low-mass limit used to integrate the SCMF. The top panel presents the scenario where the entire mass of the CG galaxy is composed of stellar clusters (Γ = 100%), while the bottom panel illustrates the case with Γ = 50%. |
| In the text | |
|
Fig. 6. Inferred past star formation activity for the five star clusters (left panels) and for the CI (right panels). From top to bottom, the best-fit solutions of the UV boosting factor (blue curve) and SFR (green curve); Monte Carlo distribution of the maximum boosting factor with median, percentiles, and fiducial values (see the text for details); Monte Carlo distribution of the sSFR (median, percentiles, and fiducial values follow the same color coding as in the middle panels). |
| In the text | |
|
Fig. A.1. Fraction of the stellar mass of the CG galaxy residing in the bound star cluster population. The SCMF is integrated down to the minimum stellar mass of 102 M⊙. Each panel presents four histograms, representing the fraction of stellar mass in star clusters calculated using four different sets of magnifications as indicated in the legend (left panel, and see text for more details). The green vertical line indicates the total stellar mass of the host galaxy located in star clusters. |
| In the text | |
|
Fig. B.1. Corner plots for the CI obtained with and without including the F150W band. Symbols and lines follow the conventions described in Fig. 3. The best-fit parameters remain largely consistent overall; however, differences appear in the posterior distributions of τ and stellar mass distributions (see text for details). |
| In the text | |
Current usage metrics show cumulative count of Article Views (full-text article views including HTML views, PDF and ePub downloads, according to the available data) and Abstracts Views on Vision4Press platform.
Data correspond to usage on the plateform after 2015. The current usage metrics is available 48-96 hours after online publication and is updated daily on week days.
Initial download of the metrics may take a while.