Fig. 5.
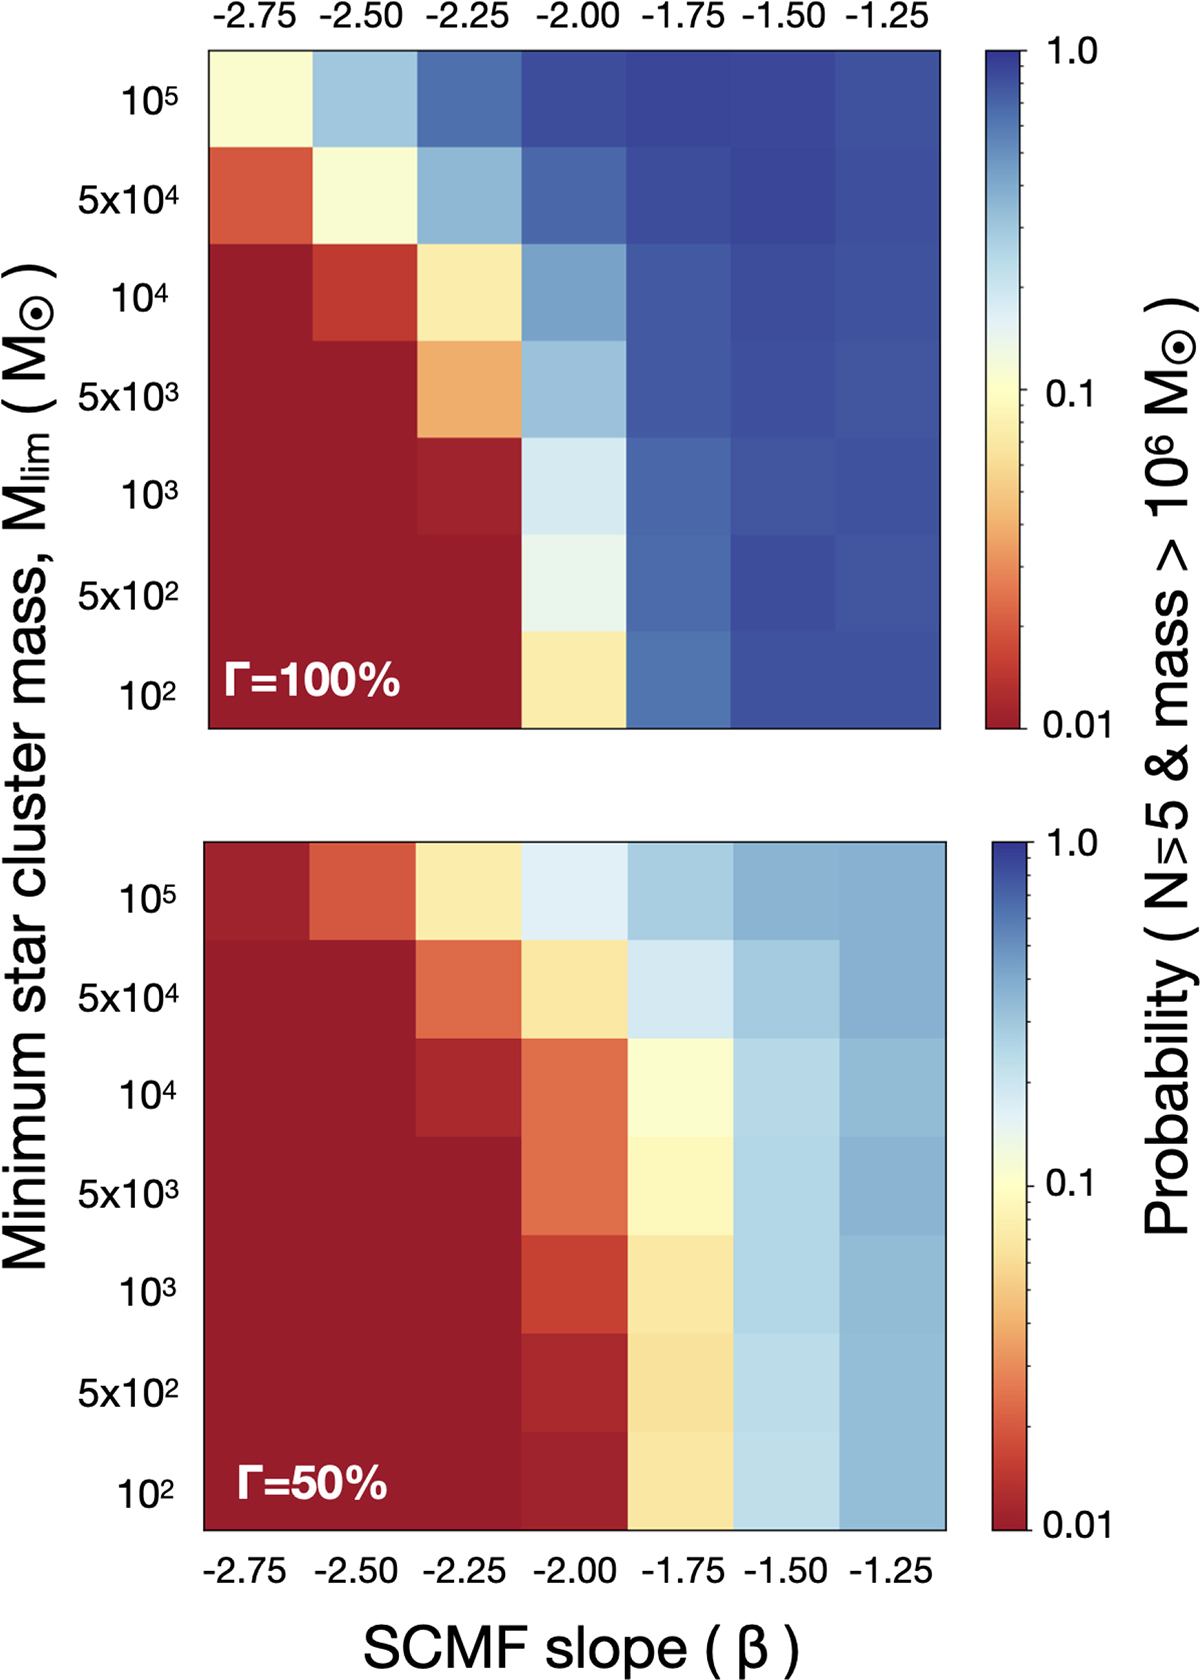
Download original image
Statistical sampling of the SCMF. The color coded probability of having five or more massive star clusters (with masses exceeding 106 M⊙) is shown as a function of the slope of the stellar cluster mass function (SCMF, β) and the low-mass limit used to integrate the SCMF. The top panel presents the scenario where the entire mass of the CG galaxy is composed of stellar clusters (Γ = 100%), while the bottom panel illustrates the case with Γ = 50%.
Current usage metrics show cumulative count of Article Views (full-text article views including HTML views, PDF and ePub downloads, according to the available data) and Abstracts Views on Vision4Press platform.
Data correspond to usage on the plateform after 2015. The current usage metrics is available 48-96 hours after online publication and is updated daily on week days.
Initial download of the metrics may take a while.