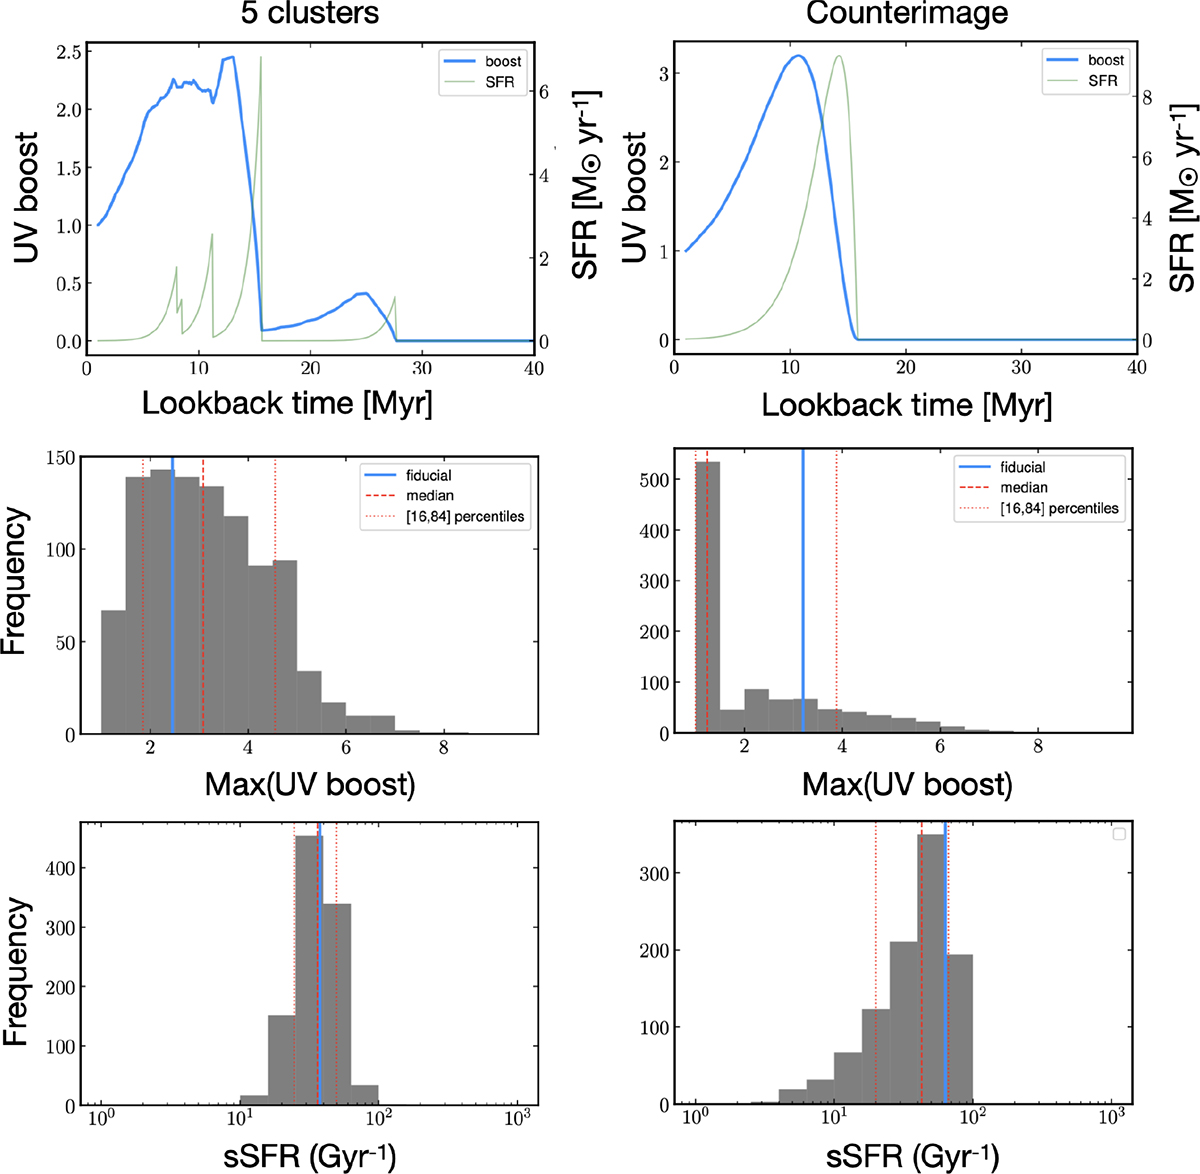
Fig. 6.
Download original image
Inferred past star formation activity for the five star clusters (left panels) and for the CI (right panels). From top to bottom, the best-fit solutions of the UV boosting factor (blue curve) and SFR (green curve); Monte Carlo distribution of the maximum boosting factor with median, percentiles, and fiducial values (see the text for details); Monte Carlo distribution of the sSFR (median, percentiles, and fiducial values follow the same color coding as in the middle panels).
Current usage metrics show cumulative count of Article Views (full-text article views including HTML views, PDF and ePub downloads, according to the available data) and Abstracts Views on Vision4Press platform.
Data correspond to usage on the plateform after 2015. The current usage metrics is available 48-96 hours after online publication and is updated daily on week days.
Initial download of the metrics may take a while.