Open Access
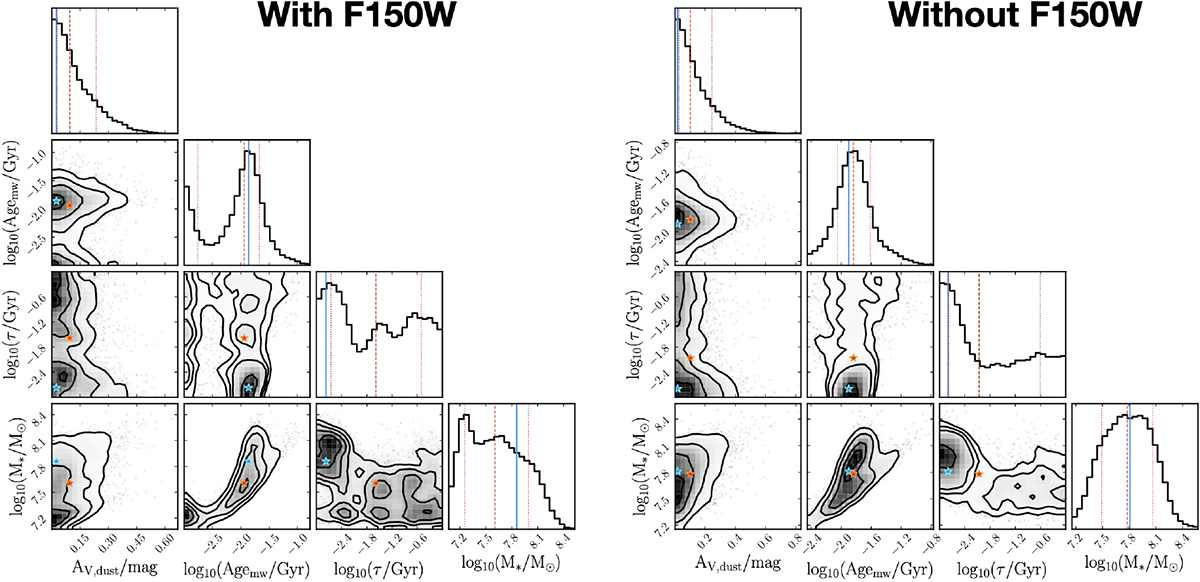
Fig. B.1.
Download original image
Corner plots for the CI obtained with and without including the F150W band. Symbols and lines follow the conventions described in Fig. 3. The best-fit parameters remain largely consistent overall; however, differences appear in the posterior distributions of τ and stellar mass distributions (see text for details).
Current usage metrics show cumulative count of Article Views (full-text article views including HTML views, PDF and ePub downloads, according to the available data) and Abstracts Views on Vision4Press platform.
Data correspond to usage on the plateform after 2015. The current usage metrics is available 48-96 hours after online publication and is updated daily on week days.
Initial download of the metrics may take a while.