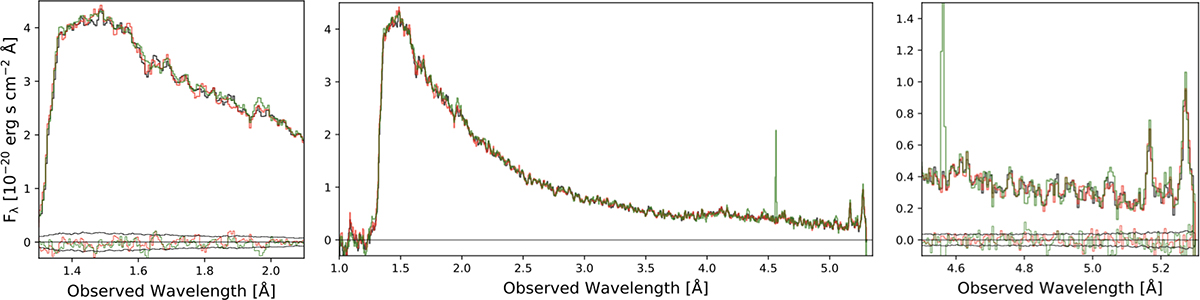
Fig. A.2.
Download original image
Comparison of the reference reduction (customized, at 50 mas, black curve) with the reduction at 100 mas (red curve) and the standard pipeline reduction (green curve). All spectra were extracted from the same region (BCDE12_CC, shown in the main text in Fig. 1). Central panel: Full spectrum. Lateral panels: Insets in the range of the Lyα drop (left) and of the emission lines (right). The difference between the reference and the other reductions is compared to the uncertainties.
Current usage metrics show cumulative count of Article Views (full-text article views including HTML views, PDF and ePub downloads, according to the available data) and Abstracts Views on Vision4Press platform.
Data correspond to usage on the plateform after 2015. The current usage metrics is available 48-96 hours after online publication and is updated daily on week days.
Initial download of the metrics may take a while.