Fig. B.1.
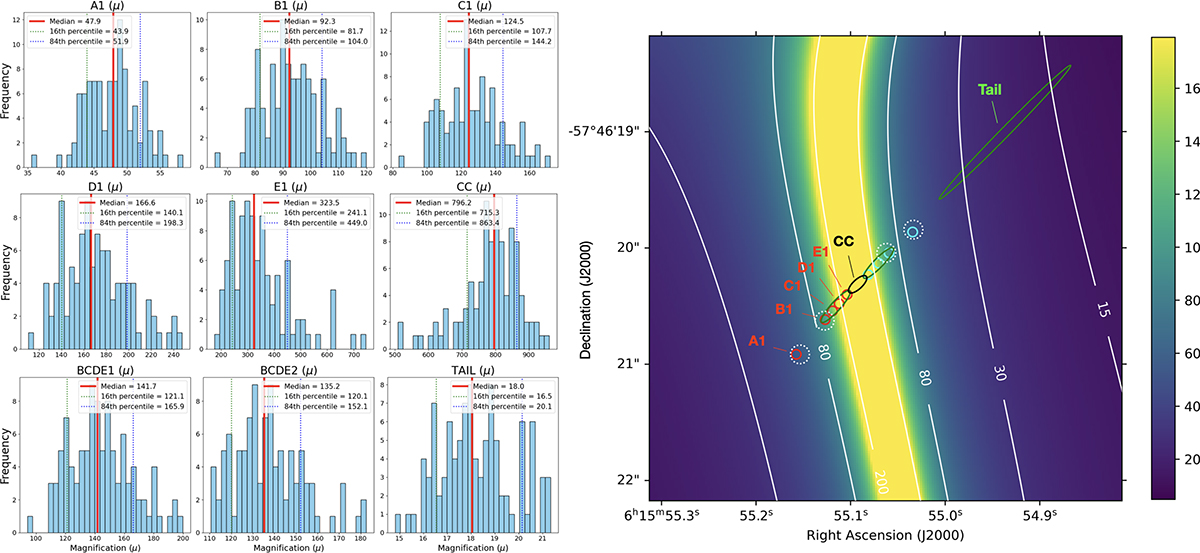
Download original image
MCMC extractions from 100 magnification maps produced with glafic as described in Section 3. Left: Histograms, medians, and 16-84% percentiles of the magnifications for the relevant regions of the Cosmic Gems arc discussed in this work. Right: Color-coded total magnification map indicating regions within which the magnifications were calculated (by computing the median of the values within the aperture). The regions correspond to the observed positions of the entries discussed in this work. As a comparison, the dotted white circles mark the model positions of the regions used among the constraints of the model. By construction, the observed and model positions are very close to each other.
Current usage metrics show cumulative count of Article Views (full-text article views including HTML views, PDF and ePub downloads, according to the available data) and Abstracts Views on Vision4Press platform.
Data correspond to usage on the plateform after 2015. The current usage metrics is available 48-96 hours after online publication and is updated daily on week days.
Initial download of the metrics may take a while.