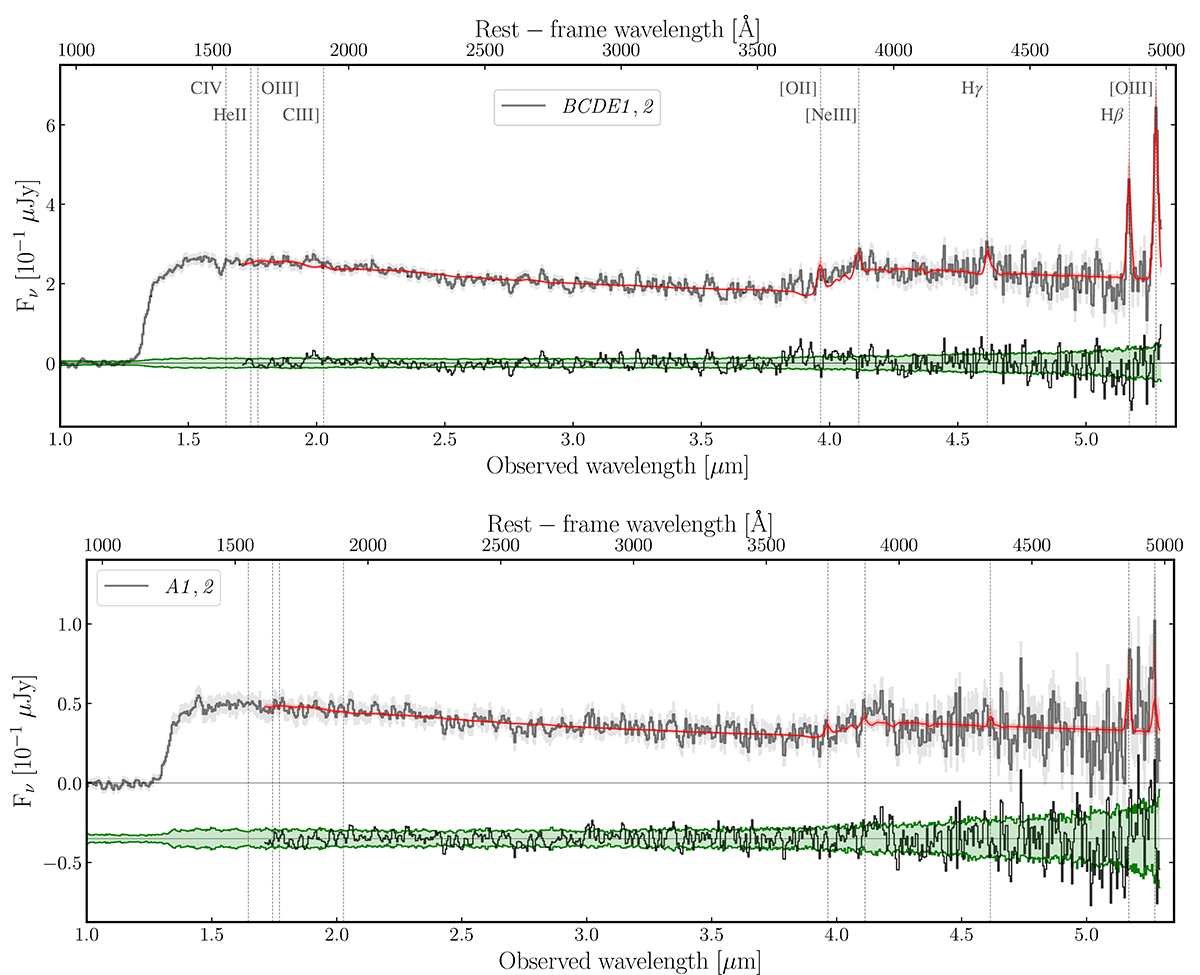
Fig. C.1.
Download original image
1D observed and best-fit spectra (gray and red curves, respectively) for the main mask apertures discussed in the main text (Section 4). The residuals between the observed and best-model spectra are shown as a black curve, while the green band encloses the ± 1σ uncertainties from the observations. Both the residuals and uncertainties are, in some cases, shifted arbitrarily to avoid confusion with the observed spectra. We note that the fit is performed only for (observed) wavelengths longer than 1.7 μm. The expected wavelengths of the main UV and optical lines are shown.
Current usage metrics show cumulative count of Article Views (full-text article views including HTML views, PDF and ePub downloads, according to the available data) and Abstracts Views on Vision4Press platform.
Data correspond to usage on the plateform after 2015. The current usage metrics is available 48-96 hours after online publication and is updated daily on week days.
Initial download of the metrics may take a while.