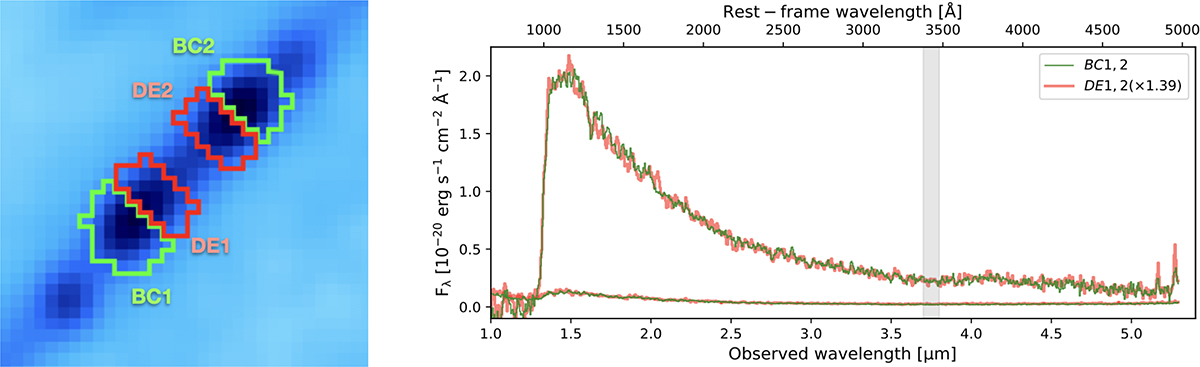
Fig. E.1.
Download original image
(Left): Division of the BCDE1 and BCDE2 mask apertures into the sub-apertures BC1-DE1 and BC2-DE2. (Right): Comparison of the 1D spectra extracted from the BC1,2 and DE1,2 mask apertures. The latter were rescaled (by a factor of 1.39) in order to match the average Fλ of BC1,2 in the observed wavelength range 3.7 to 3.8 μm. This interval was chosen to highlight possible differences between the spectra in the UV slope (blueward of 3.7 μm) or in the Balmer break amplitude (redward of 3.8 μm).
Current usage metrics show cumulative count of Article Views (full-text article views including HTML views, PDF and ePub downloads, according to the available data) and Abstracts Views on Vision4Press platform.
Data correspond to usage on the plateform after 2015. The current usage metrics is available 48-96 hours after online publication and is updated daily on week days.
Initial download of the metrics may take a while.