Fig. 3.
Download original image
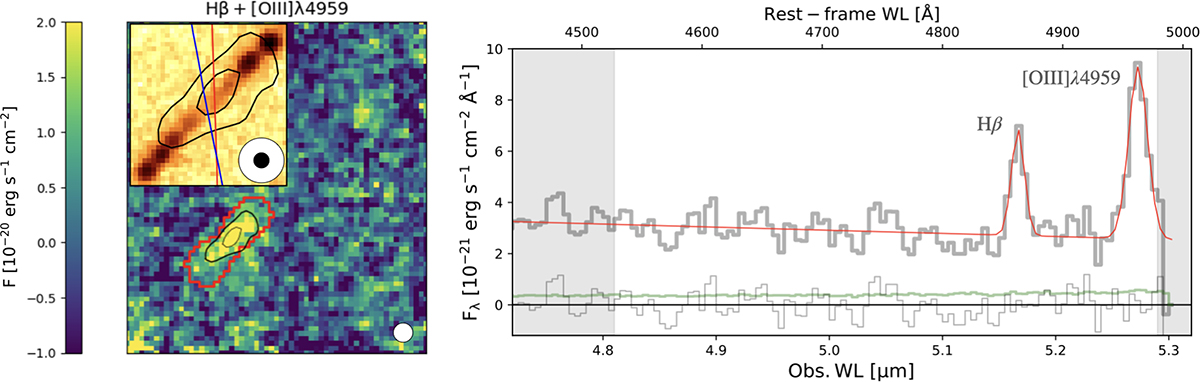
Left: 2D map of the stacked Hβ + [O III] λ4959 in the wavelength range 5.15–5.3 μm (see text for more details). The red mask corresponds to the regions BCDE1,2 and CC (defined in Fig. 1), used to extract the spectrum on the right. The inset shows the NIRCam F150W + F200W data with overlaid black contours showing the peak of the Hβ + [O III] λ4959 emission and the CCs from GLAFIC (blue) and Lenstool (red). The white circle (in both the map and the inset) denote the FWHM of the NIRSpec-IFU PSF, while the NIRCam one is plotted as a black circle in the inset. Right: 1D spectrum (thick gray line) in the wavelength range of the detected emission lines. The continuum and line best-fitting result are shown as a red line. The error spectrum and spectral fit residuals are shown in green and light gray, respectively. The gray bands mark the portion of the spectrum not included in the fit.
Current usage metrics show cumulative count of Article Views (full-text article views including HTML views, PDF and ePub downloads, according to the available data) and Abstracts Views on Vision4Press platform.
Data correspond to usage on the plateform after 2015. The current usage metrics is available 48-96 hours after online publication and is updated daily on week days.
Initial download of the metrics may take a while.