Fig. 1.
Download original image
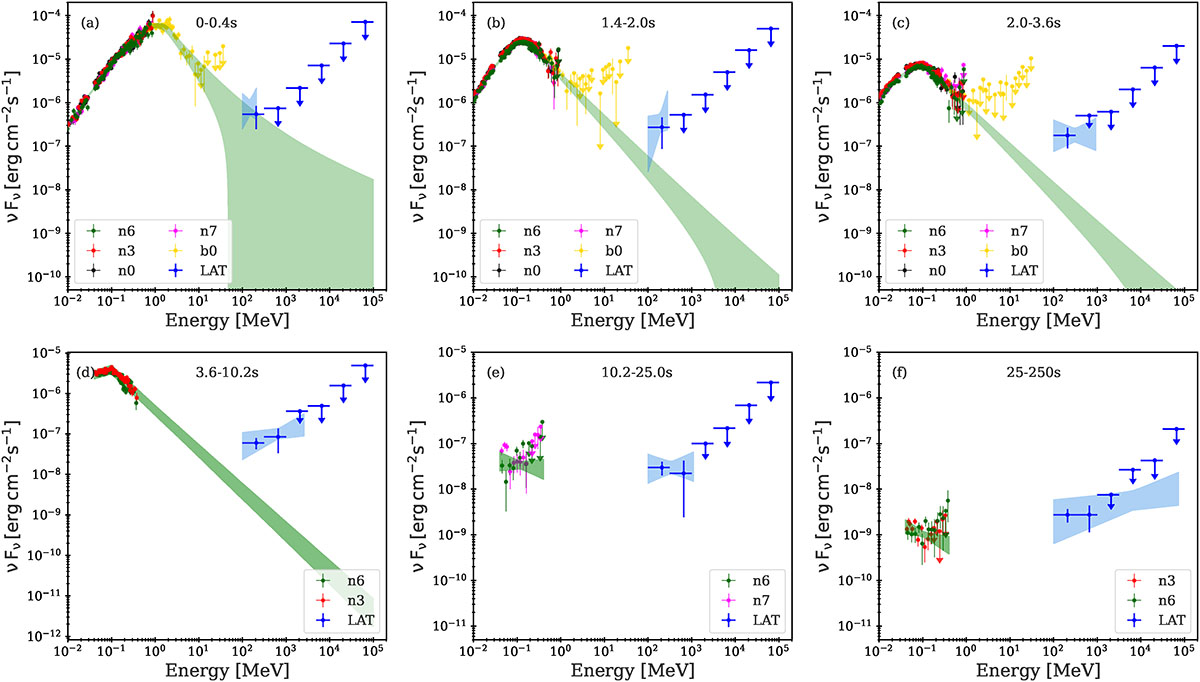
Temporal evolution of broad-band SED of GRB 230812B from Fermi/GBM (Table 1) and Fermi/LAT (Table 2) analysis. Panels (a)–(c): Prompt emission phase (bins 1–3). Panel (d): Prompt-to-afterglow transition (bin 4). Panels (e)–(f): Afterglow phase (bins 5–6). Forward-folded flux data points from the NaI and BGO detectors, as well as from LAT, are shown as filled circles. The green band depicts the best-fit model in keV-MeV band resultant from Fermi/GBM analysis (extended up to 100 GeV in bins 1–4). The blue butterflies show the power-law model fit on Fermi/LAT spectra in 0.1 − Emax. Overall SED evolution shows the emergence and evolution of the spectral components.
Current usage metrics show cumulative count of Article Views (full-text article views including HTML views, PDF and ePub downloads, according to the available data) and Abstracts Views on Vision4Press platform.
Data correspond to usage on the plateform after 2015. The current usage metrics is available 48-96 hours after online publication and is updated daily on week days.
Initial download of the metrics may take a while.