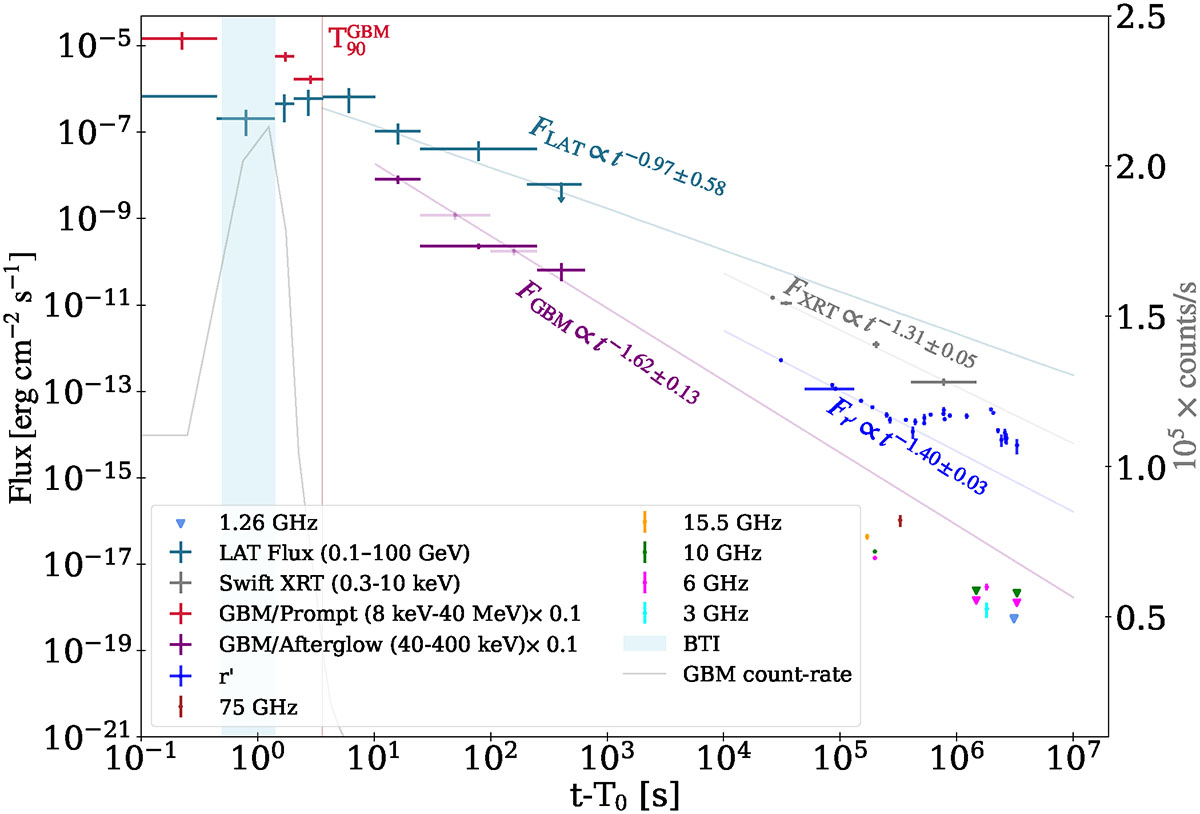
Fig. 2.
Download original image
Multi-wavelength flux light curve (left y-axis) of GRB 230812B obtained from Fermi/LAT (0.1–100 GeV), Fermi/GBM prompt (8 keV–40 MeV) and afterglow (40–400 keV), Swift/XRT (0.3–10 keV), and optical (r′) and radio (at various frequencies ranging from 1.2 to 75 GHz) telescopes. The GBM afterglow data is rescaled by a factor of 0.1 for plotting purposes. The faint data points correspond to fluxes obtained from finer time binning. The r′-band data show the optical afterglow and the emission from the associated SN. The solid lines corresponds to the best fit power-law model, F = F0(t − T0)−Γt for afterglow data from each instrument. For each instrument, the time interval used for the fit, along with the power-law index obtained as a result, is given in Table 4. The grey solid curve shows the count-rate light curve with rates depicted by the right y axis.
Current usage metrics show cumulative count of Article Views (full-text article views including HTML views, PDF and ePub downloads, according to the available data) and Abstracts Views on Vision4Press platform.
Data correspond to usage on the plateform after 2015. The current usage metrics is available 48-96 hours after online publication and is updated daily on week days.
Initial download of the metrics may take a while.