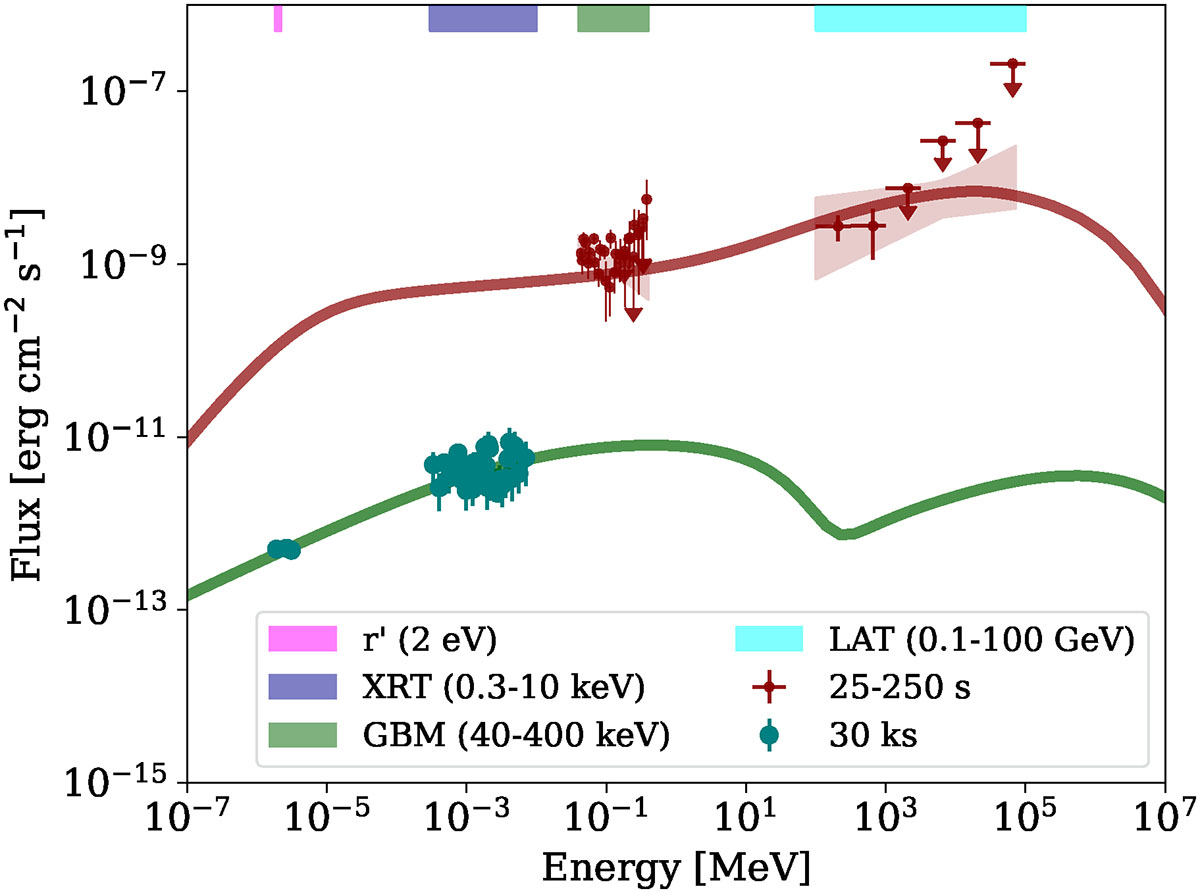
Fig. 4.
Download original image
GRB 230812B broad-band spectral energy distribution (solid red and green lines) modelling for two different time intervals, including early-time X-ray and high-energy afterglow data (25–250 s) and late-time afterglow optical and X-ray data at 30 ks. The afterglow emission is produced in the synchrotron and SSC external forward shock scenario. Observed data points (filled circles) and upper limits (arrows) from multiple instruments spanning the early to late afterglow phases are displayed. The energy bands used in the analysis are indicated in the legend: optical (r′; magenta), XRT (0.3–10 keV; purple), GBM (40–400 keV; green), and LAT (0.1–100 GeV; cyan). Details of the modelling and derived parameters are provided in Sect. 4.
Current usage metrics show cumulative count of Article Views (full-text article views including HTML views, PDF and ePub downloads, according to the available data) and Abstracts Views on Vision4Press platform.
Data correspond to usage on the plateform after 2015. The current usage metrics is available 48-96 hours after online publication and is updated daily on week days.
Initial download of the metrics may take a while.