Fig. 5.
Download original image
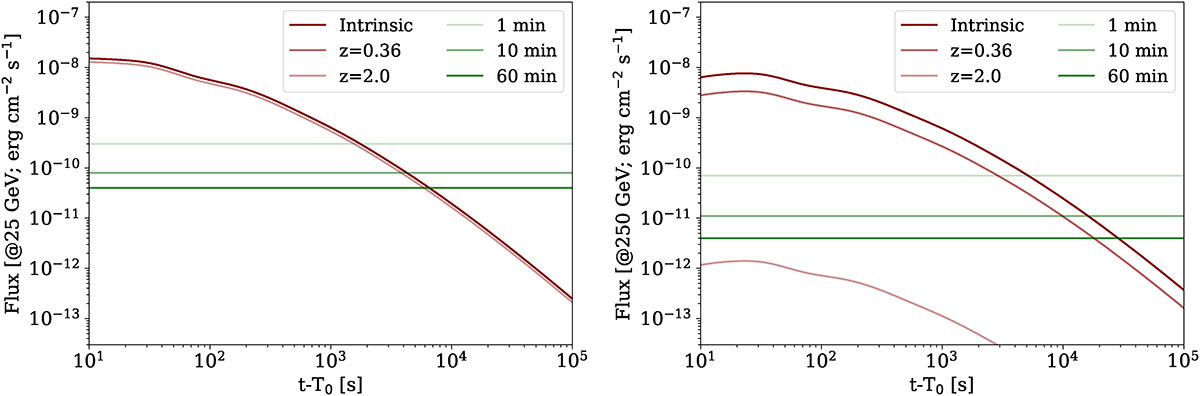
CTAO-North array detectability of the predicted γ-ray emission at 25 GeV (left plot) and 250 GeV (right plot) for GRB 230812B (z = 0.36) and for a GRB 230812B-like event but with a larger redshift of z = 2. The red lines represent the intrinsic GRB emission (dark-red), EBL-attenuated (observed) emission at redshift z = 0.36 (red), and at redshift z = 2.0 (light-red). The horizontal lines are the differential sensitivity of CTAO with different exposures: 1 min: light-green, 10 min: green, and 60 min: dark-green.
Current usage metrics show cumulative count of Article Views (full-text article views including HTML views, PDF and ePub downloads, according to the available data) and Abstracts Views on Vision4Press platform.
Data correspond to usage on the plateform after 2015. The current usage metrics is available 48-96 hours after online publication and is updated daily on week days.
Initial download of the metrics may take a while.