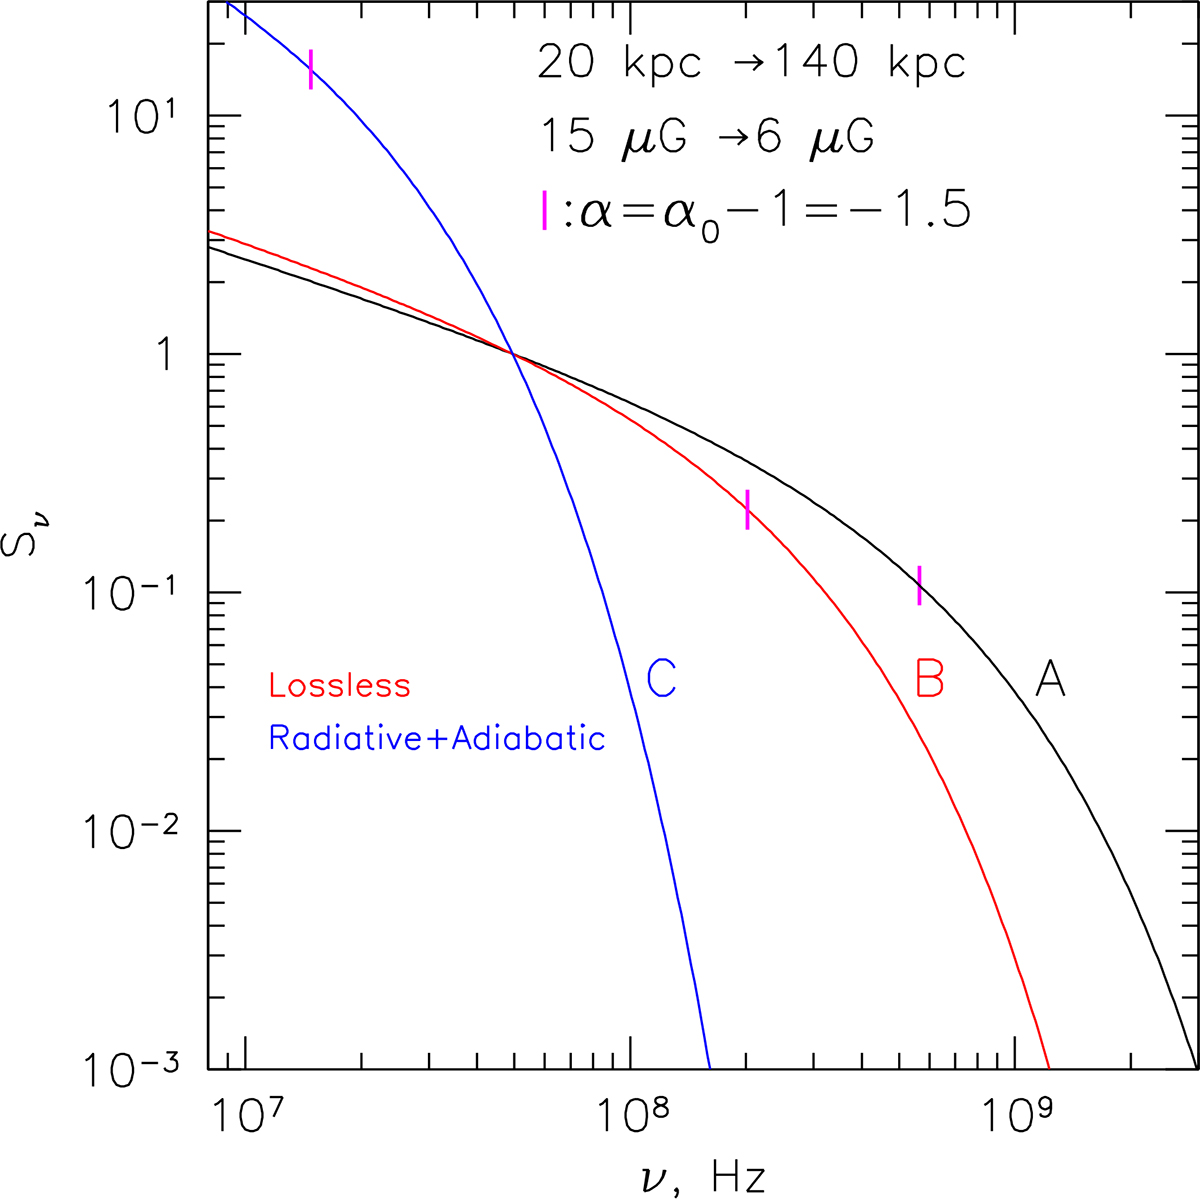
Fig. 2.
Download original image
Expected steepening of synchrotron spectra as particles move from the cluster core in the radial direction from 20 to 140 kpc. All spectra are normalized to unity at ν = 5 × 10⁷ GHz. The magnetic energy density is assumed to follow the ICM pressure profile Pt(r), i.e., Bf2/8π = Pt(r). For these simulations, we adopted a simple power law pressure profile Pt ≈ 2 × 10⁻¹⁰(r/kpc)−1 erg cm−3, derived from X-ray observation of the NEST200047 group (Majumder et al. 2025). The solid back curve (marked A) shows the synchrotron spectrum at the initial position at r1 = 20 kpc. It has a low-frequency slope α0 = −0.5 and is “aged” in the 15 μG field for 3 × 10⁷ yr so that a break develops in the spectrum. The spectra marked B and C show the evolved spectra at the final position at r2 = 140 kpc. These spectra represent two extreme limits. In particular, for C, the electrons are moving “in a bubble” from r1 to r2 with the velocity v = 500 km s−1 (just below the sound speed in the group ICM cs ∼ 700 km s−1) and suffer from the adiabatic and radiative losses. In addition to the evolution of the particle spectrum, the magnetic field is lower at r2. All these effects combined lead to a very steep spectrum at the final position. In contrast, for the “B” spectrum, we assume that electrons quickly propagate “along a static filament” and do not suffer from any losses. The only reason why the spectrum B is steeper than A is that the magnetic field is lower at the final position; hence, a lower critical frequency, νc ∝ B. For each curve, the position of the break frequency (defined here as a frequency where the spectral slope is α = α0 − 1) is shown with a small vertical magenta bar. This plot illustrates that if the initial spectrum has a break around 1 GHz, and no re-acceleration is present, any “subsonic” regime of propagation (blue lines) will result in a very steep spectrum at 100 MHz. If “fast-track” routes are available for a fraction of electrons, this might reduce the apparent steepening dramatically.
Current usage metrics show cumulative count of Article Views (full-text article views including HTML views, PDF and ePub downloads, according to the available data) and Abstracts Views on Vision4Press platform.
Data correspond to usage on the plateform after 2015. The current usage metrics is available 48-96 hours after online publication and is updated daily on week days.
Initial download of the metrics may take a while.