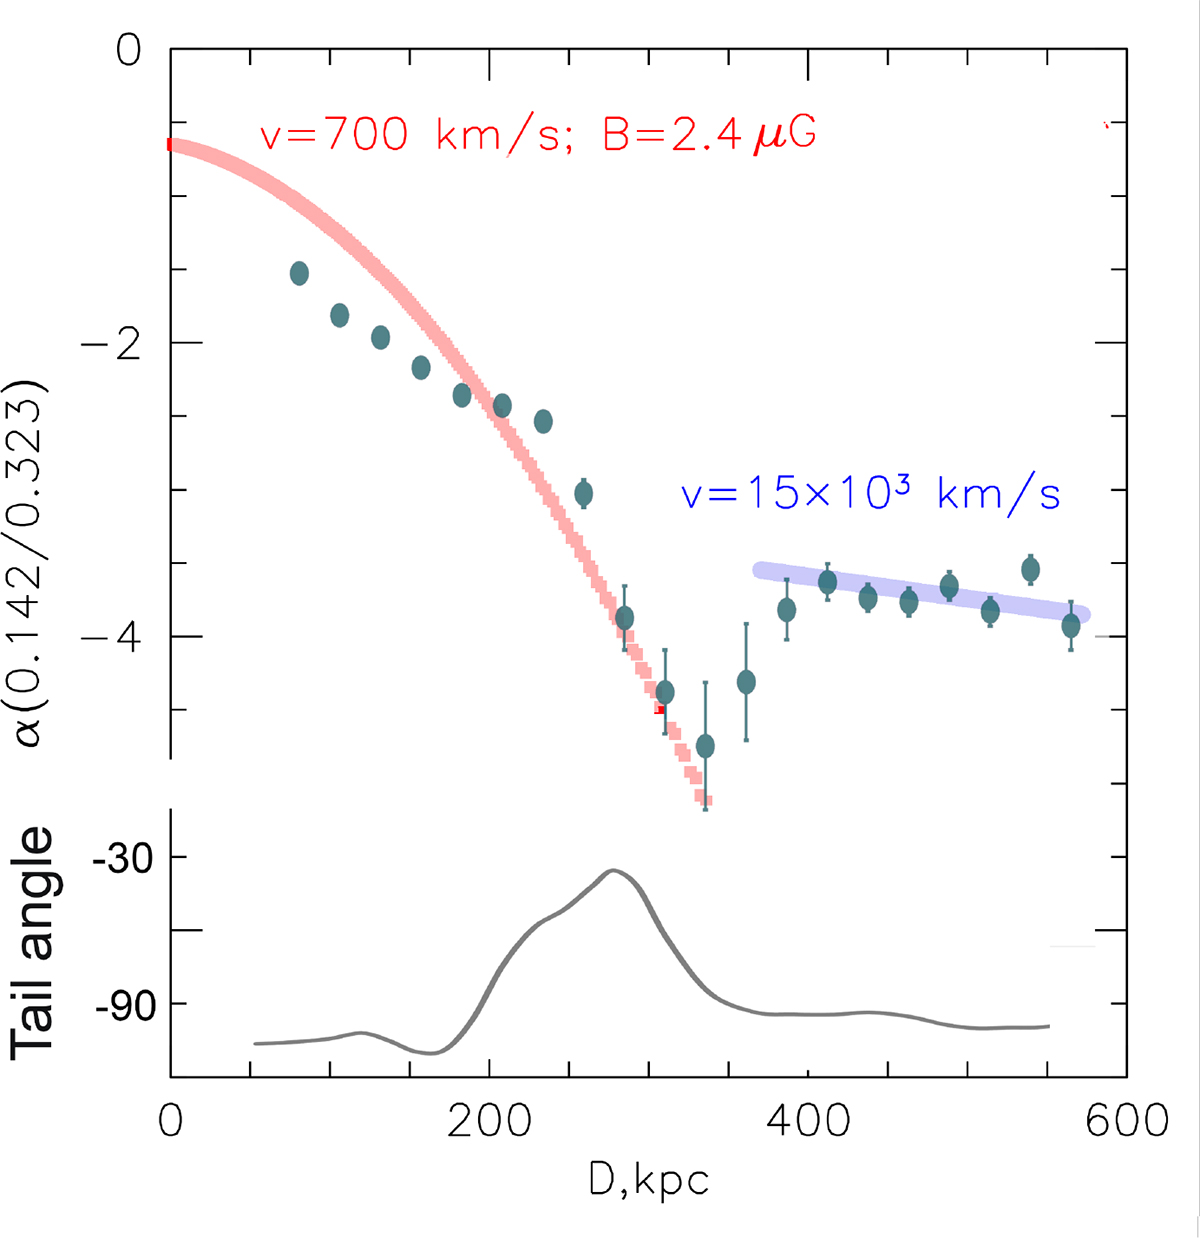
Fig. 4.
Download original image
Spectral index of the GReET tail in A1033 tail as a function of distance from the host, from Fig. 3 in de Gasperin et al. (2017). The red points show the expected steepening of an α0 = −0.65 spectrum with a low velocity for the radiating plasma, while the very modest amount of steepening in the final portion of the tail is consistent with a much higher transport velocity of 15 000 km/s, as shown in blue. The bottom plot, in solid black, shows the inferred direction of the host’s motion at each position in the tail, assuming the tail is left behind material. The variation in direction around 400 kpc is assumed to arise from a transverse flow, not from a change in the host velocity.
Current usage metrics show cumulative count of Article Views (full-text article views including HTML views, PDF and ePub downloads, according to the available data) and Abstracts Views on Vision4Press platform.
Data correspond to usage on the plateform after 2015. The current usage metrics is available 48-96 hours after online publication and is updated daily on week days.
Initial download of the metrics may take a while.