Fig. 5.
Download original image
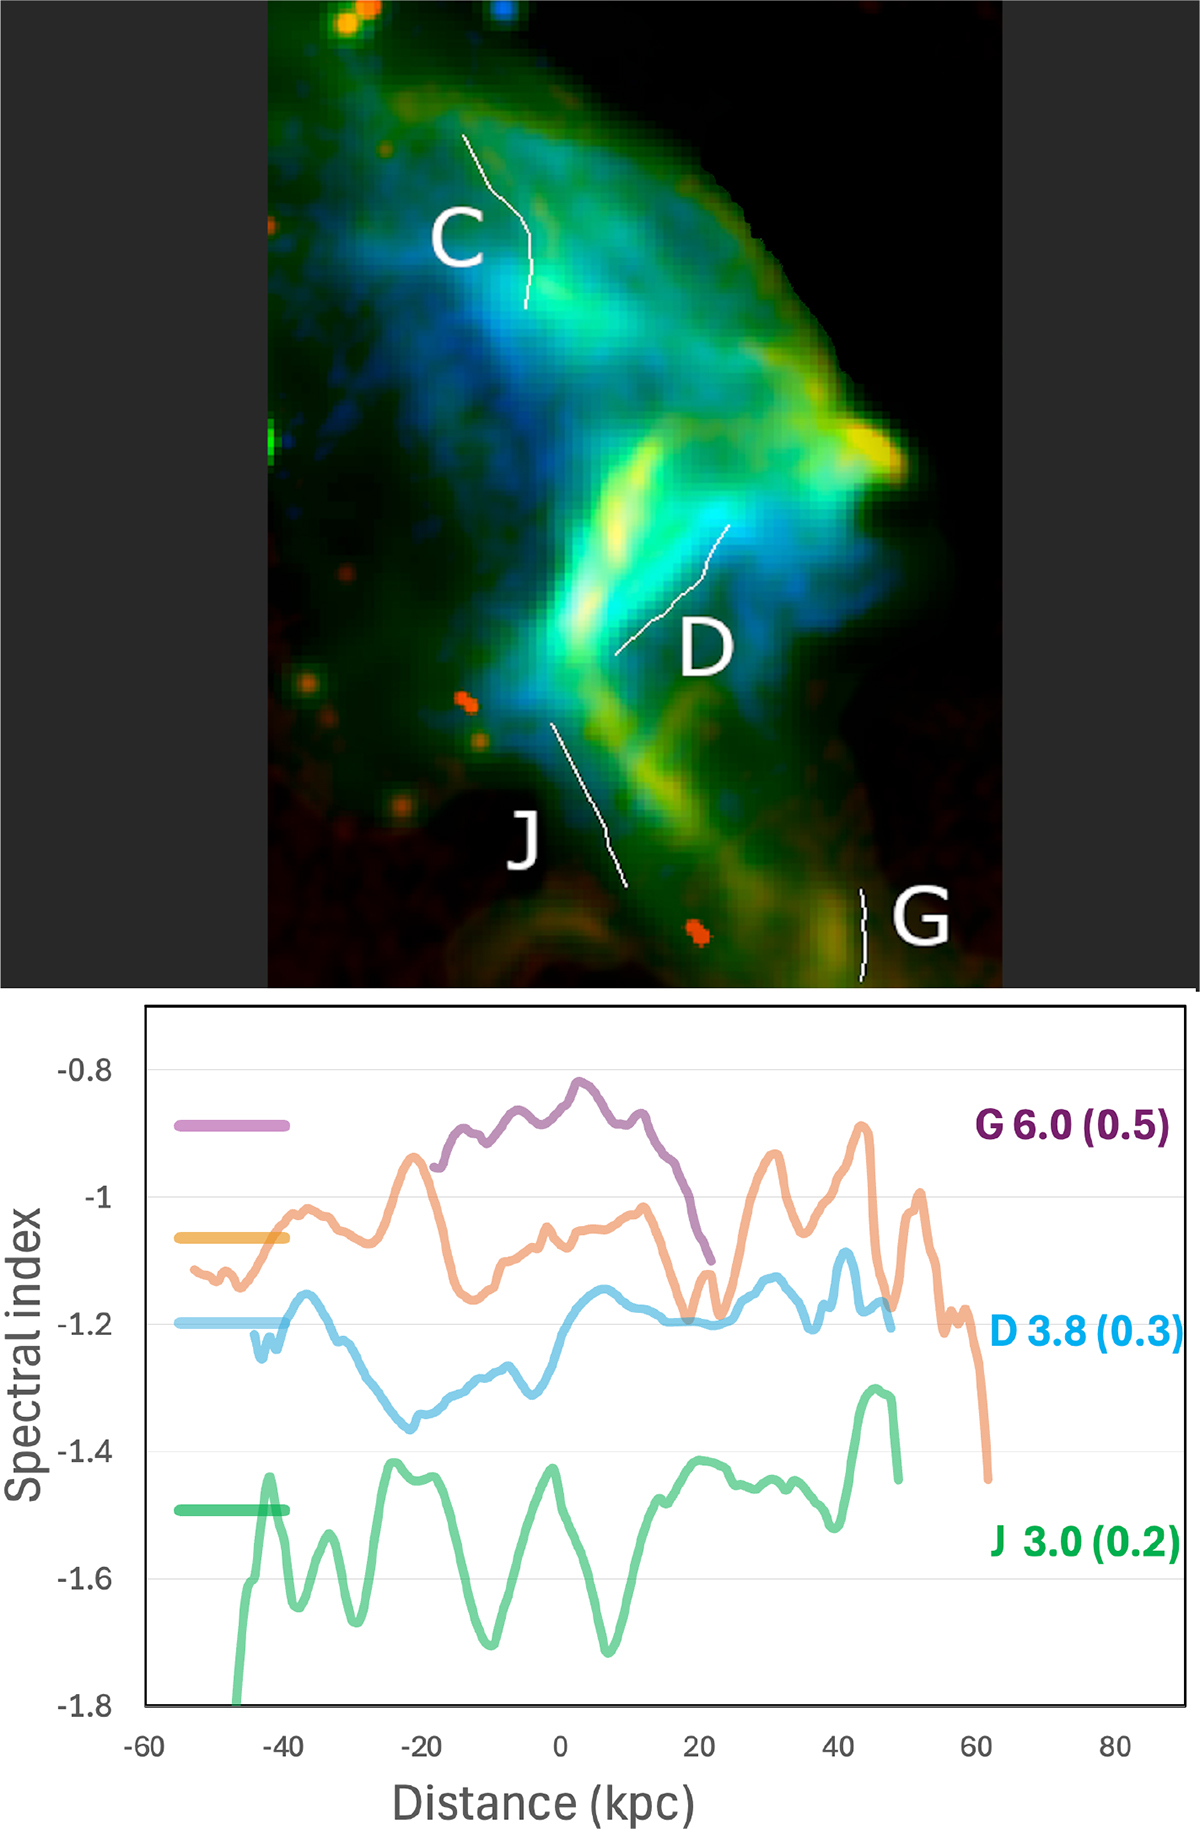
Top: NW relic of Abell 3667 from de Gasperin et al. (2017). Colors indicate the spectral indices, and different filaments show different characteristic indices. Bottom: spectral indices along five of the filaments, showing how the variations along them are significantly smaller than the differences between them. Numbers on the right indicate the equivalent Mach numbers (and their scatter) if these indices were due to DSA. Errors per measured point are just slightly smaller than the variations, so the intrinsic variations are significantly smaller than observed.
Current usage metrics show cumulative count of Article Views (full-text article views including HTML views, PDF and ePub downloads, according to the available data) and Abstracts Views on Vision4Press platform.
Data correspond to usage on the plateform after 2015. The current usage metrics is available 48-96 hours after online publication and is updated daily on week days.
Initial download of the metrics may take a while.