Fig. 2.
Download original image
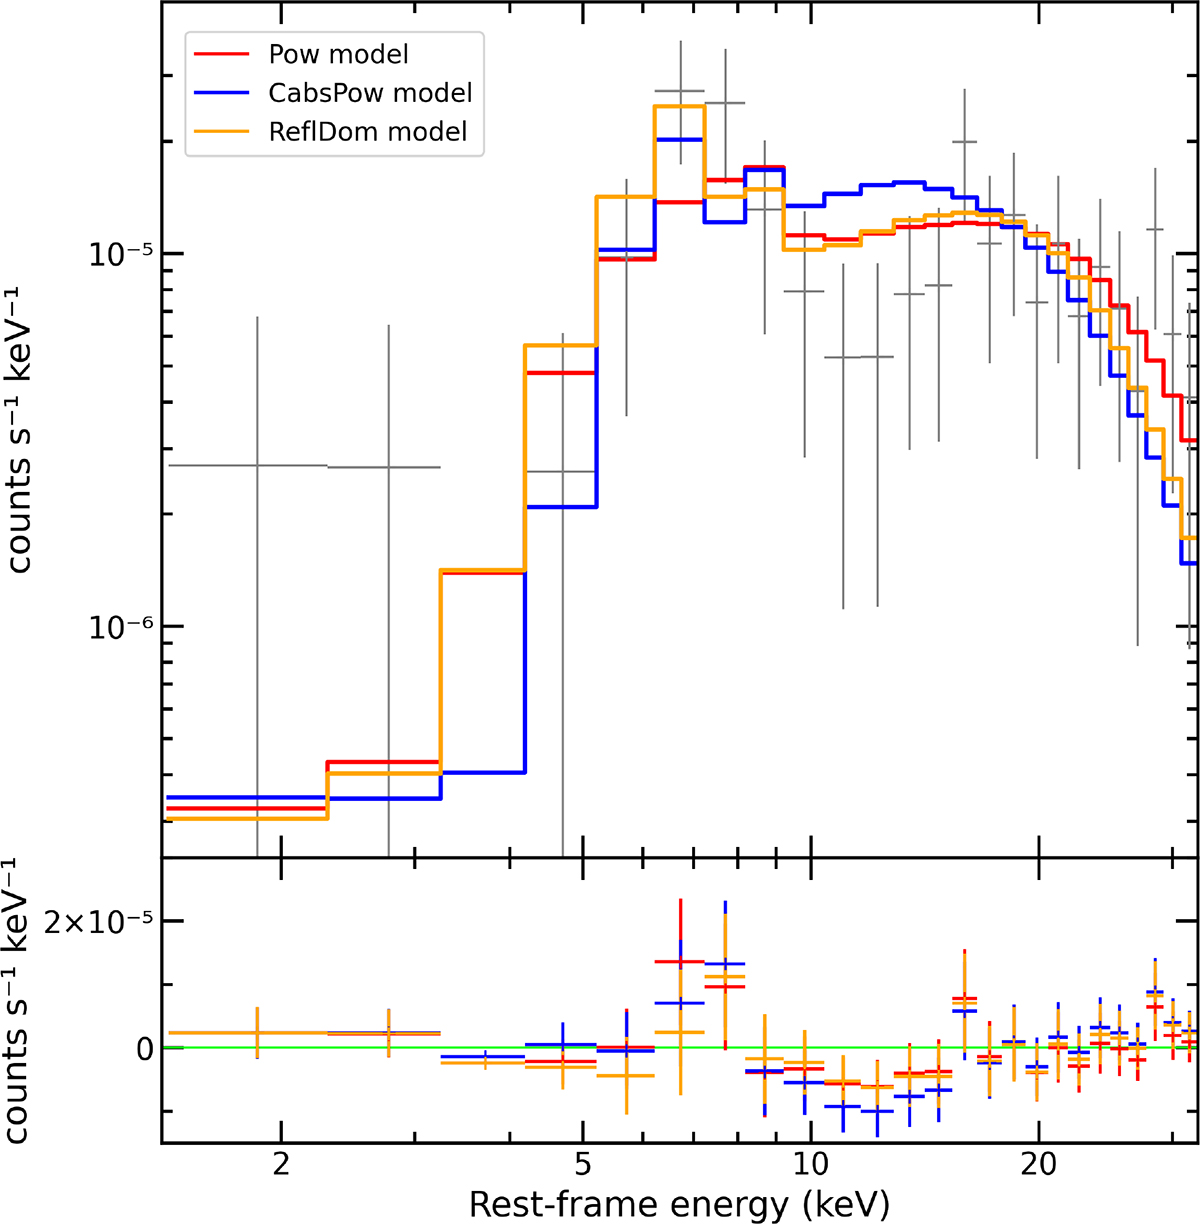
ACIS-S Chandra spectrum of W0410−09. Empirical models are reported in different colors. The POW model is shown in red, the CABSPOW model in blue, and the REFLDOM model in orange. The spectrum was slightly rebinned for better visualization. In the lower panel, the residuals for each model are shown in the same color as their respective model.
Current usage metrics show cumulative count of Article Views (full-text article views including HTML views, PDF and ePub downloads, according to the available data) and Abstracts Views on Vision4Press platform.
Data correspond to usage on the plateform after 2015. The current usage metrics is available 48-96 hours after online publication and is updated daily on week days.
Initial download of the metrics may take a while.