Fig. 3.
Download original image
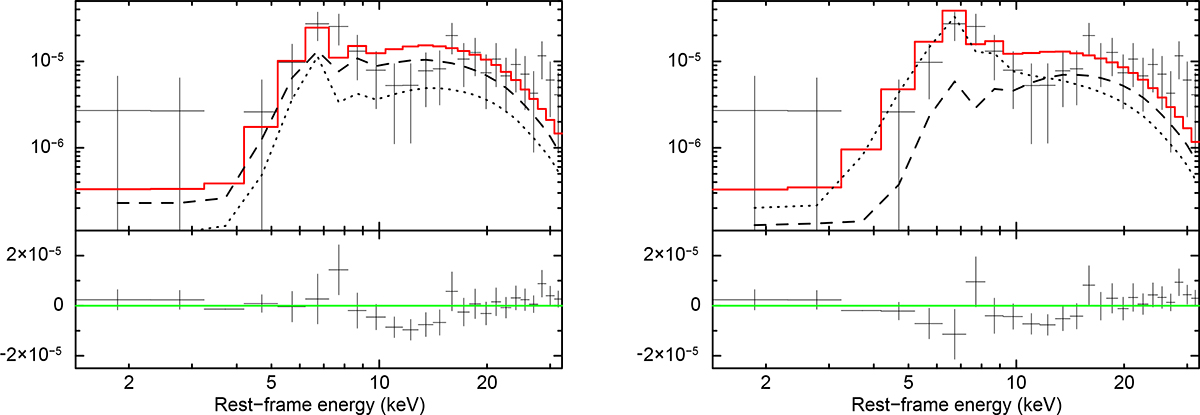
Left panel: ACIS-S Chandra spectrum with BORUS model and residuals. The solid red line represents the best-fit model, the dotted line represents the reflection component, and the dashed line represents the highly absorbed power-law continuum with an exponential cutoff. The spectra are slightly rebinned for better visualization. Right panel: ACIS-S Chandra spectrum with the BORSPHERE model and residuals. The solid red line represents the best-fit model, the dotted line represents the Compton reflection component, and the dashed line indicates the absorbed cutoff power-law component.
Current usage metrics show cumulative count of Article Views (full-text article views including HTML views, PDF and ePub downloads, according to the available data) and Abstracts Views on Vision4Press platform.
Data correspond to usage on the plateform after 2015. The current usage metrics is available 48-96 hours after online publication and is updated daily on week days.
Initial download of the metrics may take a while.