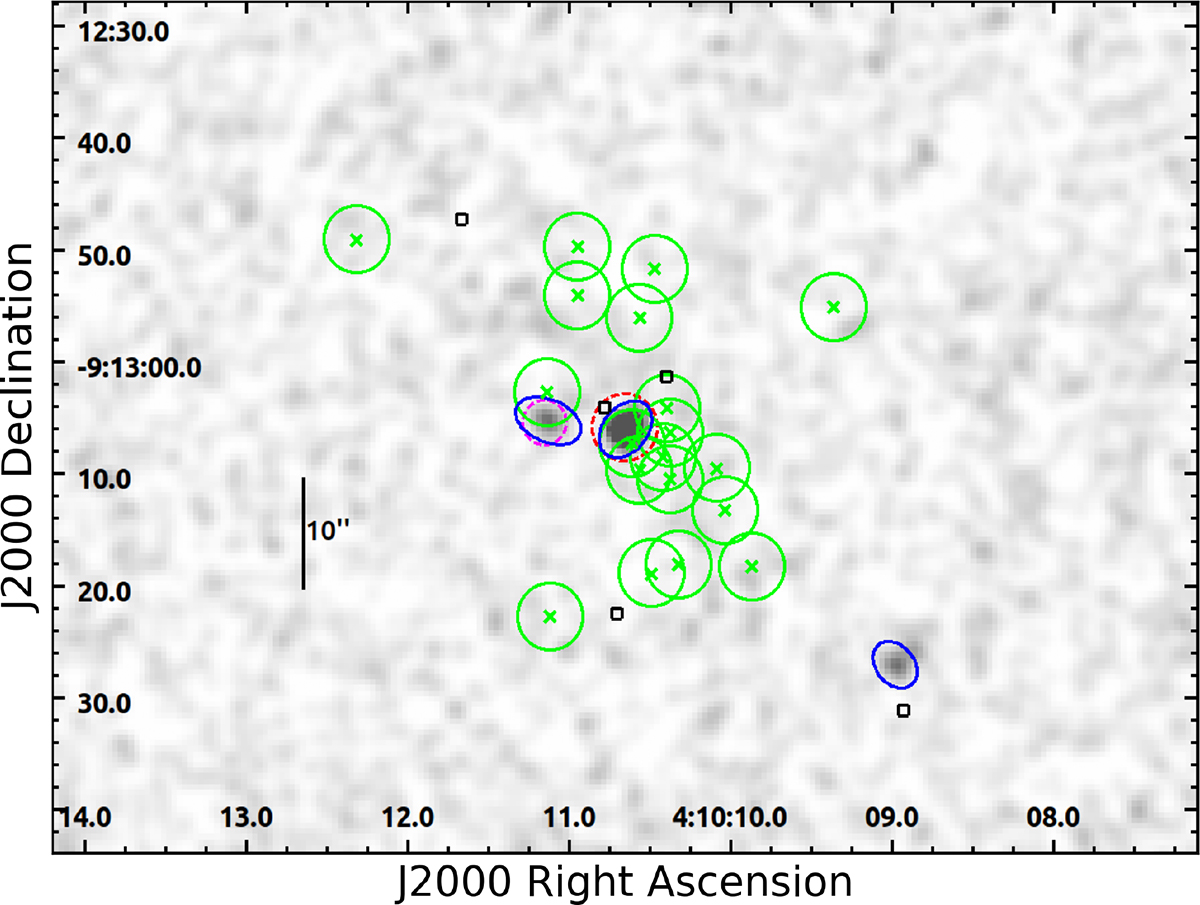
Fig. 5.
Download original image
ACIS-S image in the 0.3−7 keV energy band showing the 24 LAEs. The 19 companions associated with the Hot DOG are highlighted with green crosses, while those unrelated are indicated with black squares. The green circles mark the regions we used for the companion photometry. The X-ray sources detected using the wavdetect algorithm are shown in blue. The dashed circles indicate the regions that were excluded from the companion photometry, and the Hot DOG is shown in red.
Current usage metrics show cumulative count of Article Views (full-text article views including HTML views, PDF and ePub downloads, according to the available data) and Abstracts Views on Vision4Press platform.
Data correspond to usage on the plateform after 2015. The current usage metrics is available 48-96 hours after online publication and is updated daily on week days.
Initial download of the metrics may take a while.