Fig. 7.
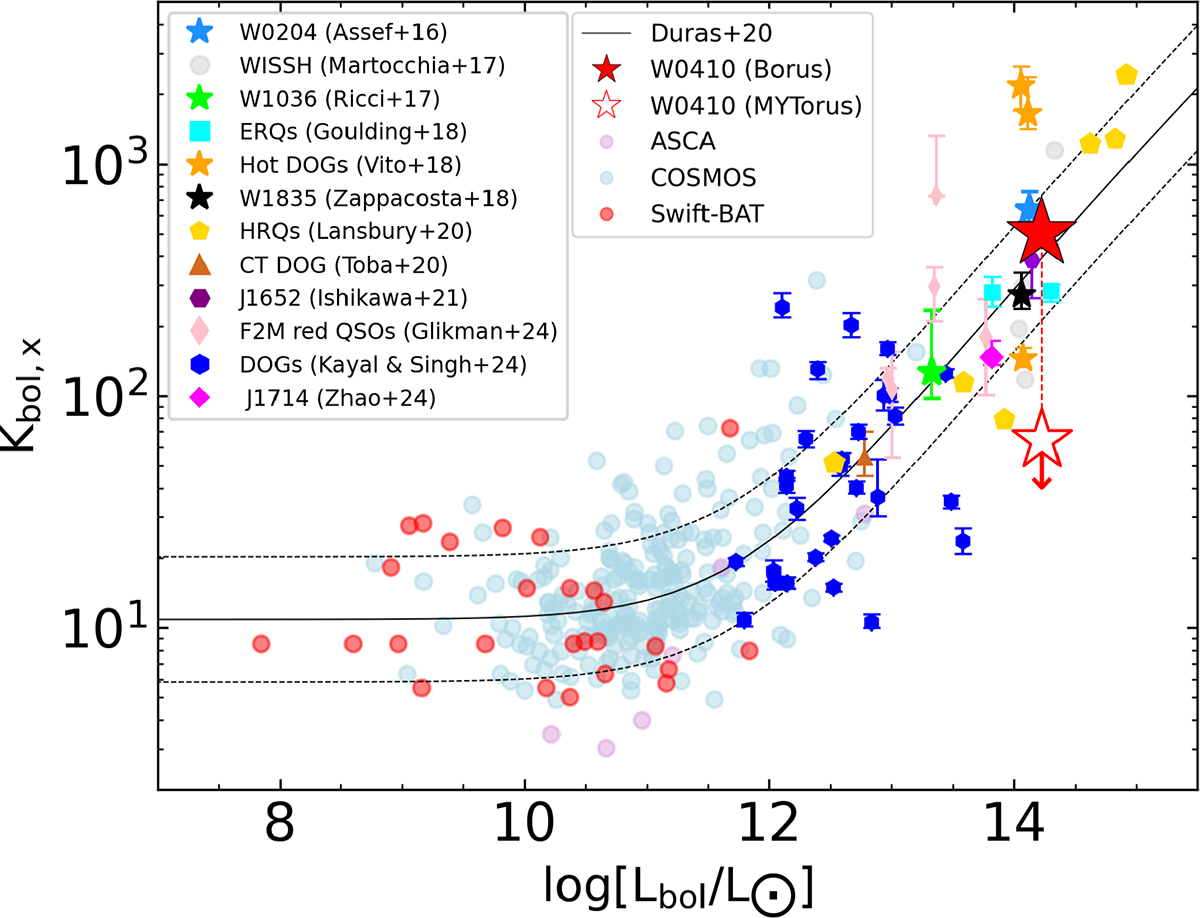
Download original image
Hard X-ray bolometric correction band as a function of the Lbol for Type II AGN. The filled and empty red stars indicate the BORUS and MYTORUS parameterizations, respectively, compared to other samples. In particular, we only include the WISSH QSOs with NH > 1023 cm−2 (gray circles; Martocchia et al. 2017). The light black lines show the best fit (continuous line) and dispersion (dashed lines) of the Kbol, X − Lbol relation for Type II QSOs from Duras et al. (2020). We also plot the ASCA, COSMOS, and Swift-BAT samples, which only include Type II AGN.
Current usage metrics show cumulative count of Article Views (full-text article views including HTML views, PDF and ePub downloads, according to the available data) and Abstracts Views on Vision4Press platform.
Data correspond to usage on the plateform after 2015. The current usage metrics is available 48-96 hours after online publication and is updated daily on week days.
Initial download of the metrics may take a while.