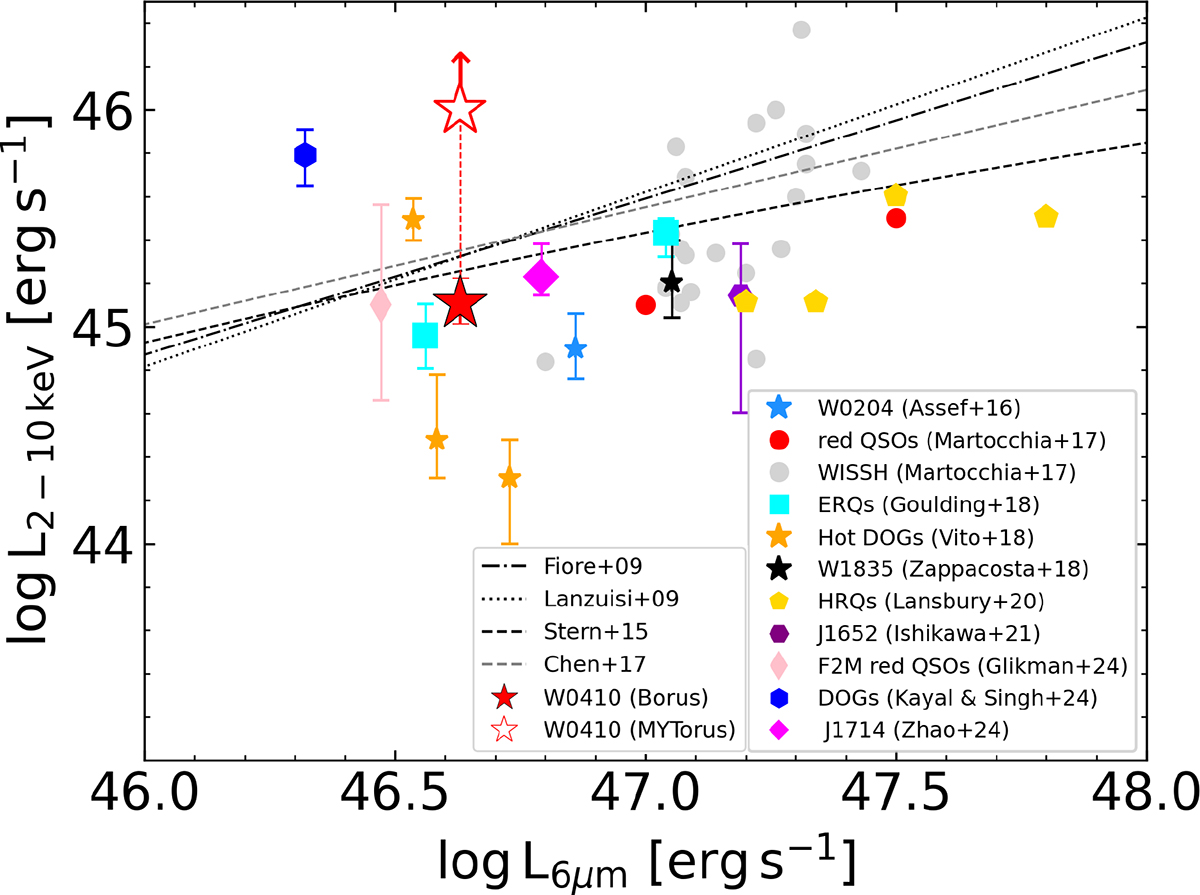
Fig. 8.
Download original image
L2 − 10 keV vs. L6 μm relation for QSOs with Lbol > 1047 erg s−1. The filled and empty red stars represent W0410−09 for the BORUS and MYTORUS models, respectively. The Hot DOGs are represented with stars of different colors, as in Fig. 6. The gray points and red dots represent the X-WISSH hyperluminous Type I QSO sample (Martocchia et al. 2017) and two reddened QSOs (Martocchia et al. 2017). We also report X-ray-to-MIR relations derived for different optical, MIR, and X-ray selected AGN samples (Fiore et al. 2009; Lanzuisi et al. 2009; Stern 2015; Chen et al. 2017).
Current usage metrics show cumulative count of Article Views (full-text article views including HTML views, PDF and ePub downloads, according to the available data) and Abstracts Views on Vision4Press platform.
Data correspond to usage on the plateform after 2015. The current usage metrics is available 48-96 hours after online publication and is updated daily on week days.
Initial download of the metrics may take a while.