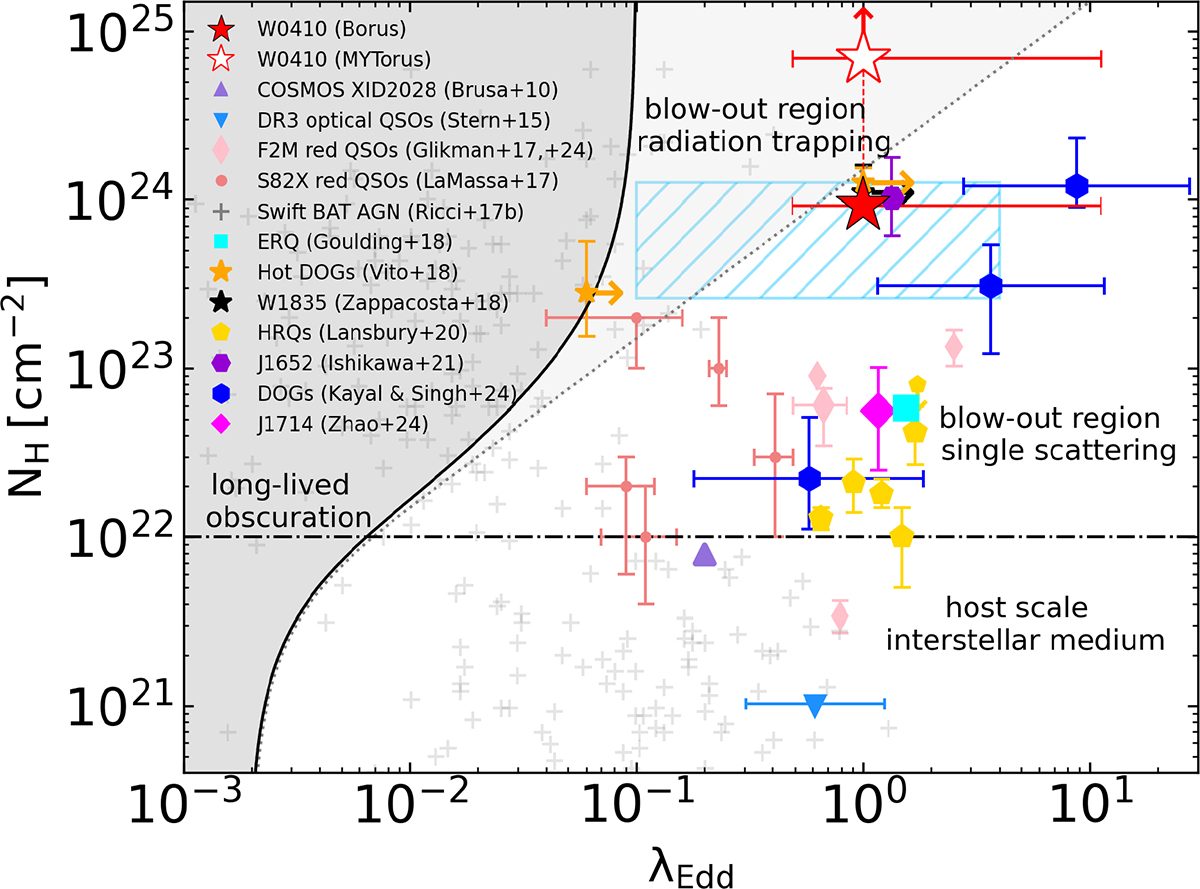
Fig. 9.
Download original image
NH vs. λEdd. We only compare sources with NH derived from spectral analysis. We report as colored points the luminous QSOs and in gray Swift-BAT low-luminosity AGN (Ricci et al. 2017b). The filled and empty red stars represent W0410−09 for the BORUS and MYTORUS models, respectively. The hatched light blue region represents the range of NH values derived from previous Hot DOG X-ray analyses (Assef et al. 2016; Vito et al. 2018; Zappacosta et al. 2018), and the λEdd range was determined using the BH masses estimated by Li et al. (2024, see our Sect. 5.2 for details). For hyperluminous optical QSOs, we show ±1σ range of λEdd values for the most luminous QSOs at z ≳ 2 in SDSS DR3 (downward-pointing light blue triangle marker, plotted at NH = 1021 cm−2). The crosses show local (z ∼ 0.037) Swift-BAT AGN (Ricci et al. 2017b). The light gray zone represents the blow-out region for radiation trapping, where the radiation emitted by the black hole is trapped in the surrounding gas through a process of repeated absorption and reemission, causing continuous heating and accelerating the gas outward (Ishibashi et al. 2018). The white zone indicates the blow-out region in the single-scattering approximation. Below, the dot-dashed line separates nuclear from the host-scale absorption.
Current usage metrics show cumulative count of Article Views (full-text article views including HTML views, PDF and ePub downloads, according to the available data) and Abstracts Views on Vision4Press platform.
Data correspond to usage on the plateform after 2015. The current usage metrics is available 48-96 hours after online publication and is updated daily on week days.
Initial download of the metrics may take a while.