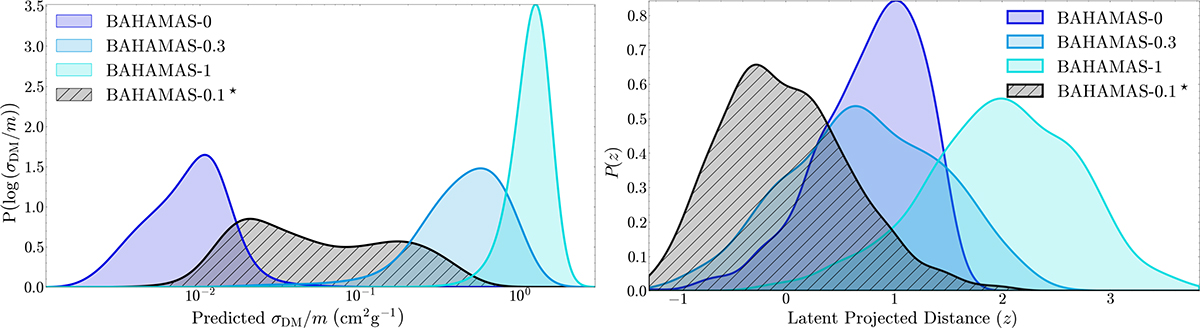
Fig. 5.
Download original image
Consistency check on in-distribution testing. Left: Trained ensemble of three clustering NNs and combined PDF of log(σDM/m) for the known BAHAMAS-0, BAHAMAS-0.3, and BAHAMAS-1 (solid blue shades) and unknown BAHAMAS-0.1 (dashed black). We find a cross-section of ∼0.05 cm2 g−1 and within 1σ of 0.1 cm2 g−1 for BAHAMAS-0.1. Right: Projected 7D latent space from our clustering algorithm into a 1D distance PDF, where each known simulation (blue shades) is projected in the direction from the centre of their distribution to the centre of BAHAMAS-0.1. BAHAMAS-0.1 (hatched black) is projected in the direction of BAHAMAS-0.3 to show the greatest overlap. The distance has arbitrary units as it depends on the scale of the latent space. BAHAMAS-0.1 shares a large overlap of 49% and 55% with BAHAMAS-0 and BAHAMAS-0.3, respectively, leading to the conclusion that it lies within the training domain.
Current usage metrics show cumulative count of Article Views (full-text article views including HTML views, PDF and ePub downloads, according to the available data) and Abstracts Views on Vision4Press platform.
Data correspond to usage on the plateform after 2015. The current usage metrics is available 48-96 hours after online publication and is updated daily on week days.
Initial download of the metrics may take a while.