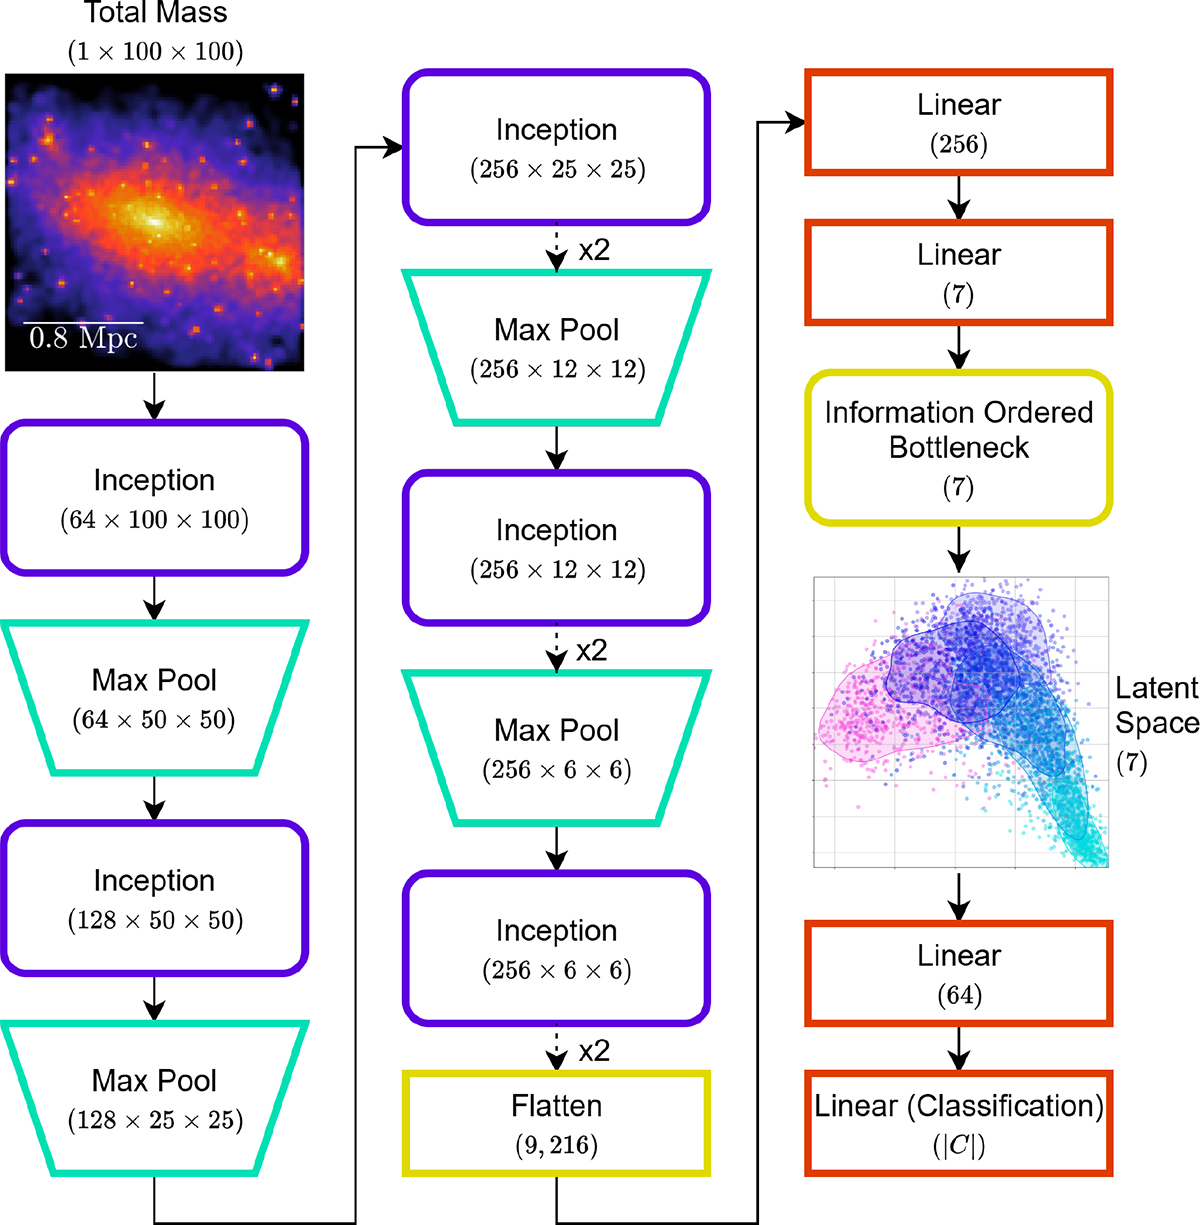
Fig. B.1.
Download original image
Full network architecture used in the paper. The network is composed of inception blocks (purple, rounded rectangles), show in Figure B.2, max pooling layers (turquoise, trapeziums), linear layers (red, rectangles), a flatten layer (yellow, rectangle), and an information-ordered bottleneck layer (yellow, rounded rectangle). The output dimensions of each layer is represented underneath the name of the layer, the arrows represent the direction of data flow and if there is a ×2 next to the arrow, then the layer is repeated twice. The input is the total mass maps and optionally X-ray maps of galaxy clusters and the latent space is where we calculate the loss functions from equations 1 and 3 as well as our feature analysis.
Current usage metrics show cumulative count of Article Views (full-text article views including HTML views, PDF and ePub downloads, according to the available data) and Abstracts Views on Vision4Press platform.
Data correspond to usage on the plateform after 2015. The current usage metrics is available 48-96 hours after online publication and is updated daily on week days.
Initial download of the metrics may take a while.