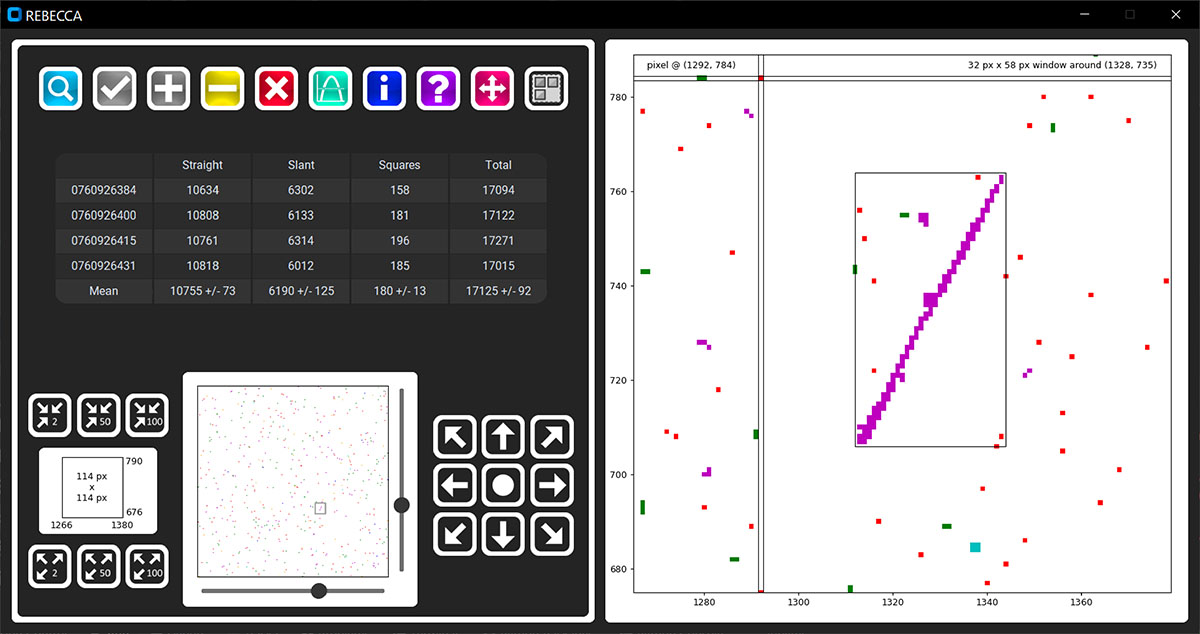
Fig. 14.
Download original image
Example of automated and visual analysis carried out with REBECCA. Left panel: four different matrices corresponding to the peak of the same SEP event are analyzed at once. The mean number of particle tracks in the sets of analyzed cosmic-ray matrices and standard deviations are reported in the bottom row of the table in the figure. Right panel: subregion of a cosmic-ray matrix is shown, after the automated analysis. By default, the last opened matrix is shown. Users can change this behavior by clicking on a different row of the table in the left panel. When dragging the mouse over the shown subregion, the corresponding matrix pixel’s coordinates are shown in the top left corner. When “Select mode” is on, it is possible to draw rectangles around tracks of interest and the corresponding coordinates are reported in the top right corner. A quick guide of REBECCA, explaining the functionalities associated with each button of the interface, is accessible through the “?” button in the main window.
Current usage metrics show cumulative count of Article Views (full-text article views including HTML views, PDF and ePub downloads, according to the available data) and Abstracts Views on Vision4Press platform.
Data correspond to usage on the plateform after 2015. The current usage metrics is available 48-96 hours after online publication and is updated daily on week days.
Initial download of the metrics may take a while.