| Issue |
A&A
Volume 705, January 2026
|
|
|---|---|---|
| Article Number | A103 | |
| Number of page(s) | 13 | |
| Section | The Sun and the Heliosphere | |
| DOI | https://doi.org/10.1051/0004-6361/202556636 | |
| Published online | 09 January 2026 | |
Galactic and solar energetic particle observations during the increasing part of solar cycle 25 with EPD/HET and Metis on board Solar Orbiter
1
DiSPeA, University of Urbino Carlo Bo Urbino (PU), Italy
2
INFN Florence, Italy
3
LIGM, Univ Gustave Eiffel, CNRS F-77454 Marne-la-Vallée, France
4
University of Florence, Department of Physics and Astronomy, Via Sansone 1 50019 Sesto Fiorentino (FI), Italy
5
INAF – Astrophysical Observatory of Torino, Italy
6
Institut für Experimentelle und Angewandte Physik, Christan-Albrechts-Universität zu Kiel Kiel, Germany
7
Universidad de Alcalá, Space Research Group 28805 Alcalá de Henares, Spain
8
INAF – Astronomical Observatory of Capodimonte Naples, Italy
9
CNR – IFN Via Trasea 7 35131 Padova, Italy
10
CISAS, Centro di Ateneo di Studi e Attività Spaziali “Giuseppe Colombo” Via Venezia 15 35131 Padova, Italy
11
INAF – Astrophysical Observatory of Catania Catania, Italy
12
Institute of Physics, University of Graz Universitätsplatz 5 8010 Graz, Austria
13
Solar-Terrestrial Centre of Excellence – SIDC, Royal Observatory of Belgium Ringlaan -3- Av. Circulaire 1180 Brussels, Belgium
14
INAF – Astronomical Observatory of Trieste Loc. Basovizza n. 302 34149 Trieste, Italy
15
Dept. of Physics, University of Trieste Via A. Valerio 2 34127 Trieste, Italy
16
National Institute for Nuclear Physics, Division in Trieste Via A. Valerio 2 34127 Trieste, Italy
17
Dip. di Fisica e Astronomia “Galileo Galilei”, Università di Padova, Via G. Marzolo 8 35131 Padova, Italy
18
Max Planck Institute for Solar System Research Justus-von-Liebig-Weg 3 37077 Göttingen, Germany
19
ASI – Italian Space Agency Via del Politecnico snc 00133 Rome, Italy
20
INAF – Arcetri Astrophysical Observatory Largo Enrico Fermi 5 I-50125 Florence, Italy
21
MPS Göttingen, Germany
22
INAF – Institute for Space Astrophysics and Cosmic Physics Milan, Italy
★ Corresponding author: This email address is being protected from spambots. You need JavaScript enabled to view it.
Received:
28
July
2025
Accepted:
3
November
2025
Abstract
Context. Galactic cosmic rays (GCRs) and solar energetic particles (SEPs) with energies greater than tens of megaelectron volts are at the origin of spacecraft deep charging. The High Energy Telescope of the Energetic Particle Detector instrument measures the particle flux incident on the Solar Orbiter spacecraft. An algorithm implemented in the processing electronics of the visible light (VL) instrument of the Metis coronagraph generates cosmic-ray matrices containing the pixels fired by high-energy particles. These independent observations allow us to monitor the secondary particle production into the spacecraft.
Aims. We studied the GCR flux long-term variations during the ascending phase of solar cycle 25 and the evolution of two SEP events observed on July 24–26, 2023, and on February 9–14, 2024, above 80 MeV with the aim of evaluating the impact of galactic and solar high-energy particles on Metis.
Methods. A Python tool named REBECCA has been developed for the automated analysis of the Metis cosmic-ray matrices. The number of observed particle tracks is compared to Monte Carlo simulations of the Metis VL bidimensional CMOS sensor used as a particle detector.
Results. We present the modulation of the GCR energy spectrum from 2020 through 2024 above 100 MeV. The dynamics of two intense SEP events is also reported. Monte Carlo simulations indicate that the composition of particles in the cosmic-ray matrices is dominated by protons. Going from solar minimum to maximum, an increase in particles produced by cosmic rays in the spacecraft material surrounding Metis was observed. Conversely, during the whole evolution of SEP events, protons made up more than 90% of the particles. These observations were gathered near the ecliptic during a positive polarity epoch of the global solar magnetic field. Analogous studies will be conducted during the negative polarity epoch, within 1 au, both above and below the ecliptic plane, throughout the remaining duration of the mission.
Key words: instrumentation: detectors / Sun: particle emission / solar-terrestrial relations / cosmic rays
© The Authors 2026
 Open Access article, published by EDP Sciences, under the terms of the Creative Commons Attribution License (https://creativecommons.org/licenses/by/4.0), which permits unrestricted use, distribution, and reproduction in any medium, provided the original work is properly cited.
This article is published in open access under the Subscribe to Open model. This email address is being protected from spambots. You need JavaScript enabled to view it. to support open access publication.
1. Introduction
Solar Orbiter is the ESA/NASA observatory (Müller et al. 2020; García Marirrodriga et al. 2021) devoted to investigating how the Sun creates and controls the heliosphere. The mission was launched on February 10, 2020, at 04:03 UT from Cape Canaveral (Florida, USA). The Solar Orbiter satellite orbited the Sun between 0.28 au and 1 au close to the ecliptic plane until 2024. In February 2025 the spacecraft (S/C) began tilting its orbit with respect to the ecliptic.
Solar Orbiter hosts four in situ and six remote-sensing instruments. The Metis coronagraph is one of the latter (Antonucci et al. 2020; Fineschi et al. 2020; Romoli et al. 2021), and its aim is imaging for the first time the solar corona in visible light (VL, in the range 580–640 nm) and in ultraviolet light (UV, in a ≃20 nm band around the 121.6 nm H I Lyman-α line).
Galactic cosmic rays (GCRs) and solar energetic particles (SEPs) traverse or interact with the satellite, thus affecting the performance of the scientific instruments. Particularly relevant is the sharp increase in S/C internal charging during medium-strong SEP events (see for similar studies Grimani et al. 2022; Wass et al. 2023; Dimiccoli et al. 2025). The work illustrated here was initially developed for the Metis instrument diagnostics to monitor the spurious pixels fired by high-energy particles in the images of the corona throughout the mission (Grimani et al. 2021, 2023, 2024a). To this end, an algorithm was implemented in the electronics of the VL bidimensional CMOS sensor (see for details Andretta et al. 2014; Grimani et al. 2021, and references therein), to separate noisy pixels and those crossed by high-energy particles from those fired by VL photons. This separation is allowed since the energy deposits of high-energy particles in the sensitive part of the VL camera are higher than those of photons. The spurious pixels fired by charged particles and the noisy pixels in the Metis VL images are stored in standard FITS1 format files named cosmic-ray matrices. After removing the noisy pixels appearing in all images, the analysis of the remaining ones allows us to use the instrument as a particle detector placed inside the Solar Orbiter satellite. Automated and visual analyses of the Metis cosmic-ray matrices have been carried out.
Monte Carlo simulations (Vlachoudis 2009; Battistoni et al. 2014; Böhlen et al. 2014) were performed and compared to cosmic-ray matrix analyses to study the composition of particles inside the S/C (Grimani et al. 2021, 2023, 2024a). As is known, the calculation of the doses transferred to the instruments is dependent on the typology of the particles (Telloni et al. 2016).
Measurements of high-energy particle spectra carried out by the High Energy Telescope (HET) instrument of the Energetic Particle Detector (EPD, Rodríguez-Pacheco et al. 2020) outside the S/C are used as input data for Monte Carlo simulations. The HET consists of two units which together provide four viewing directions: sun, antisun, north, and south with an incomplete coverage of the solid angle. Although our main goal was to monitor the Metis VL instrument performance throughout the mission, we also gained precious insights regarding the long-term modulation of GCRs and on the evolution of medium-strong SEP events above tens of megaelectron volts.
Solar Orbiter was launched at solar minimum between solar cycle 24 and solar cycle 25 during a positive polarity epoch of the global solar magnetic field (GSMF). We recall that the GSMF polarity epoch is defined as positive (indicated by A > 0) when the magnetic field lines are directed away from the north pole of the Sun, and as negative (A < 0) when the magnetic field lines point toward the north pole of the Sun. During A > 0 cycles, positive GCR particles undergo a global drift motion from the solar poles toward the equator, while negative particles propagate along the heliospheric current sheet toward the Sun. The opposite holds during negative polarity periods of the GSMF (see for instance Potgieter & Langner 2004; Grimani 2004, 2007; Laurenza et al. 2014). Cosmic rays propagating along the heliospheric current sheet lose more energy than those coming from the poles (Strauss et al. 2011). Drift effects were observed to determine maximum reductions of the GCR proton and helium fluxes during a negative polarity epoch of 40% at 100 MeV, 30% at 200 MeV, 25% near 1 GeV, and a few percentage points up to 4 GeV at solar minimum (Boella et al. 2001) when the Sun’s magnetic field is more organized and the heliospheric current sheet is confined to the low-latitude region. At solar maximum, the drift process is found to be ineffective.
At the time of writing, solar cycle 25 had just exhibited a second peak of activity after the first one shown in August 2023 and was completing the transition from A > 0 polarity to A < 0 polarity. In this work we report the study of the long-term variations in the GCR flux in 2020–2024 above 100 MeV during the ascending phase and maximum of solar cycle 25 before the complete polarity change of the GSMF from A > 0 to A < 0. In the future we would like to compare the results presented in this article with those obtained under similar conditions of solar activity but in negative polarity, above and below the ecliptic. In the past, analogous measurements were performed with the near-Earth magnetic spectrometer PAMELA experiment and the Ulysses mission (De Simone et al. 2011). PAMELA was launched in 2006 and terminated in 2016. The Ulysses mission was designed to observe the Sun’s poles on an orbit inclined up to 80.2°. Ulysses was launched in 1990 and terminated in 2009. PAMELA and Ulysses gathered data simultaneously from 2006 to 2009 near solar minimum and during a negative polarity period of the GSMF. These two missions allowed the study of the GCR flux radial and latitudinal gradients from 1 au through 4 au and between ±50° in latitude. Variations of −0.024%/degree in latitude and 2.7%/au in radial distance from the Sun were detected. The comparison of the observations of the two missions are reported in Figure 3 in De Simone et al. (2011). As can be observed in that figure, the precision of the comparison was mainly limited by the KET instrument on board Ulysses. We plan to use the data from EPD/HET during the final phase of the mission for the comparison of observed GCR gradients to those of PAMELA, Ulysses and other near-Earth experiments performing similar measurements at the same time of Solar Orbiter.
The results of our work find applications in other instruments of Solar Orbiter or in different missions with a similar amount of shielding material for which the deep charging of the S/C represents a major limitation to their sensitivity. In particular, the correlation of particle data gathered outside the S/C with analogous observations into the S/C are of interest for the future interferometers for gravitational wave detection in space such as the Laser Interferometer Space Antenna, LISA (Araújo et al. 2005; Grimani et al. 2022, 2024b, 2025; Wass et al. 2023; Dimiccoli et al. 2025).
In Section 2 we describe the characteristics of the Metis VL images and cosmic-ray matrices. In Section 3 the GCR energy spectrum modulation during the Solar Orbiter mission is discussed. In Section 4 the evolution of SEP events above 80 MeV on July 24–26, 2023, and on February 9–14, 2024, is presented along with solar eruptions and coronal mass ejections (CMEs) associated with particle acceleration. In Section 5 we briefly describe the Python tool, named Rapid ElaBoration interfacE for CosmiC-ray mAtrices (REBECCA), developed for the automated analysis of the cosmic-ray matrices. In Section 6 we present the results of the analysis of cosmic-ray and solar particle tracks in the cosmic-ray matrices carried out with REBECCA. Finally, in Section 7, observations and Monte Carlo simulations of GCR and SEP primary and secondary particles in the cosmic-ray matrices are compared.
2. Metis cosmic-ray matrices
An illustration of the attitude of the Solar Orbiter S/C along its orbit is shown in Fig. 1. The location of the Metis coronagraph and of the EPD/HET instrument units are indicated by red arrows. Metis allows us to image the global corona in polarized VL in the range 580–640 nm and in UV light at 121.6 nm of the H I Lyman-α line (see for details Antonucci et al. 2020; Fineschi et al. 2020).
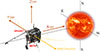 |
Fig. 1. Sketch of the Solar Orbiter S/C. The positions of the Metis coronagraph and of the two units of the EPD/HET instrument are indicated by red arrows. XORF, YORF, ZORF indicate the Solar Orbiter optical reference frame. Image credit: European Space Agency. |
The Metis VL channel consists of a VL camera with an active CMOS (CMOSIS ISPHI Rev. B developed by the CMOSIS Imaging sensor, now AMS, Belgium) segmented in 4.1943 × 106 pixels arranged in a matrix of 2048 pixels in width and 2048 pixels in height. Each pixel has an area of 10 μm × 10 μm and a thickness of 4.5 μm. The geometrical factor of each pixel is 401 μm2 sr (Sullivan 1971). On average, more than 10 g/cm2 of S/C and instrument material prevent particles with energies below 80 MeV from passing through the Metis VL camera. As we note above, we used the cosmic-ray matrices generated by an algorithm implemented in the Metis electronics for particle observations inside the Solar Orbiter S/C. The efficiency of single pixels for particle detection (defined as the ratio of fired pixels to the total number of pixels along particle slant tracks) was estimated as follows. A sample of slant tracks was selected under the condition that each row of the pixel matrix along the main particle track contained no more than one fired pixel, thereby minimizing contamination from knock-on electrons or photon interactions. The pixel efficiency was found to be 0.94±0.02 (see Grimani et al. 2021, for details). It should be noted that this estimate represents a lower limit to the actual efficiency of the pixels, because in slant tracks particles crossing the CMOS have a higher probability to pass through the corners of the pixels with respect to straight tracks.
Across both the current and previous analyses, we have also estimated the efficiency of the algorithm generating the cosmic-ray matrices (Grimani et al. 2023, 2024a). This efficiency remained constant throughout the mission, as discussed in Section 7.
The UV images gathered with the Metis UV instrument (Uslenghi et al. 2017; Schühle et al. 2018) were not used for particle studies, due to the difficulty in separating photons and particle tracks for a quantitative analysis.
3. Cosmic-ray long-term modulation during the ascending phase of solar cycle 25
Galactic cosmic rays with energies exceeding tens of megaelectron volts contribute to the generation of tracks appearing in the Metis cosmic-ray matrices. Galactic cosmic rays consist mainly of protons (90% in particle number to the total number) and nuclei (9%), with a minor fraction of electrons (1%) and other particles (< 1%; Simpson 1983; Papini et al. 1996). The proton percentage increases to 99% in SEPs (Reames 2021). Solar energetic particles rarely present energies well above 10–20 MeV (Grimani et al. 2013). Even so, the overall flux of particles incident on the mission S/C increases by several orders of magnitude during SEP events by causing a large increase in the S/C internal charging and dose absorption (Christl et al. 2009; Telloni et al. 2016; Grimani et al. 2022).
Monte Carlo simulations were carried out in order to study the composition of the particles crossing the Metis cosmic-ray matrices. The geometry of the S/C was reproduced in the simulations (see details in Grimani et al. 2021, 2023, 2024a). Due to the predominant component of protons in both GCRs and SEPs, in the following we focus on these particles as representative of the whole GCR and SEP samples. Input cosmic rays and SEP energy spectra are measured up to 1 GeV on board Solar Orbiter2. A force-field description of the overall solar modulation (G&A; Gleeson & Axford 1968) has been adopted to extend the GCR proton energy spectra above 1 GeV (see for a similar approach; Grimani et al. 2008; Armano et al. 2018). The GCR intensities in the inner heliosphere are correlated to interstellar energy spectra through a solar modulation parameter (ϕ) representing the energy loss (diffusion, convection, continuous energy losses) of cosmic rays. We note that in the G&A work the GCR drift process was not included.
The solar modulation parameter is positively correlated with solar activity, but its value varies depending on whether it is derived from different interstellar particle spectra, neutron monitor data, or space-based observations. We adopted the solar modulation parameter determined by Usoskin et al. (2011, 2017)3 At the time of writing, these authors reconstructed the monthly values of the solar modulation parameter from ground-based neutron monitors from 1936 through December 2024. This interval of time fully covers the period of our analyses. The proton spectra used in the Monte Carlo simulations were derived from the interstellar proton spectrum proposed by Burger et al. (2000), which was also adopted to set the solar modulation parameter values considered here for the studied periods of time. We are aware that different choices could have been made (see for instance Corti et al. 2019; Zhu et al. 2021) for the solar modulation parameter and interstellar proton energy spectra estimated with space-based data. Unfortunately, to our knowledge, no values of the solar modulation parameter estimated with space data are available for the periods of our analyses.
In Fig. 2 we report the monthly sunspot number4 (see Clette et al. 2014, for details about sunspot number calibration) as a proxy of solar activity (Brehm et al. 2021) and the monthly solar modulation parameter after the Solar Orbiter launch.
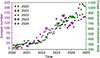 |
Fig. 2. Monthly sunspot number and solar modulation parameter from February 2020 through December 2024. The stars within circles indicate the periods during which the past and present GCR and SEP analyses were carried out (Grimani et al. 2021, 2023, 2024a). |
The stars within circles indicate the periods during which we carried out our analyses, and were chosen with the specific aim of considering periods of different solar activity.
In Fig. 3 the stars of different colors indicate the proton cosmic-ray observations by EPD/HET properly binned after the Solar Orbiter launch. The bin widths are indicated by horizontal bars. Statistical errors dominate the systematic uncertainties on the proton flux. For comparison with our data, we also present observations from the HEPD-01 experiment on board the CSES-01 satellite (Martucci et al. 2023). These observations were collected near Earth during December 2020–January 2021 and December 2021–January 2022. It should be noted that the solar modulation parameter was lower in May 2020 than in late 2020–early 2021, and higher in May 2022 relative to late 2021–early 2022. When the effects of a different solar modulation are taken into account, an acceptable agreement between the two datasets is observed above 80–100 MeV. Below this energy, the Solar Orbiter data appear higher than those gathered by HEPD-01. This evidence is associated with the different requirements underlying the analysis of proton data. In the GCR proton analysis of HEPD-01, any period characterized by particle acceleration by the Sun, in the interplanetary medium, or during Forbush decreases were excluded. Conversely, we only omitted intervals of time during which gradual SEP events characterized by proton acceleration above 80 MeV were observed. It follows that during all other periods below 80 MeV there remains a component of particles accelerated by the Sun or in the interplanetary medium in addition to GCRs. This scenario accounts for the progressively larger differences between our data and HEPD-01 measurements at energies below 80 MeV. For this same reason, our GCR observations agree better with the proton spectra parameterizations above 100 MeV for the indicated values of the solar modulation parameter. We decided to adopt this approach since the 80–100 MeV energy interval is critical for the impact of protons on cosmic-ray matrices.
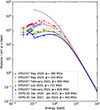 |
Fig. 3. EPD/HET proton data after the Solar Orbiter launch (colored stars). The top dotted line represents the adopted interstellar proton energy spectrum gathered from Burger et al. (2000). The triple-dot-dashed line, the double-dot-dashed line, the dot-dashed line, the dashed line, and the continuous line correspond to the proton energy spectra estimated in the force-field approximation of solar modulation for the indicated periods. |
The curves reported in Fig. 3 indicate the GCR proton spectra above 100 MeV estimated on the basis of the indicated solar modulation parameter following the work by G&A. These curves, if extended below 100 MeV, do not capture the trend of our data, except at solar minimum, due to proton components accelerated by impulsive SEP events or interplanetary shocks (McDonald et al. 1976; Barnes & Simpson 1976; Tsurutani et al. 1987; Desai et al. 1998; Giacalone et al. 2002; Lario 2005; Laurenza et al. 2015; Wang et al. 2025). These energy spectra are used as input data for the Monte Carlo simulations discussed in Section 7 above 100 MeV. Input fluxes between 80 and 100 MeV were obtained as a best fit to the data.
The energy loss of GCR protons propagating in the inner heliosphere with energies lower than 100 MeV is dominated by adiabatic expansion, while diffusion and convection are predominant above 100 MeV (Potgieter et al. 2013; Vos & Potgieter 2015). The adiabatic expansion is the process associated with proton cooling due to the expansion of the medium. In our commentary on Figure 2 in Grimani et al. (2021), we noted that large uncertainties affecting differential proton flux data available in the literature were not providing clear clues on the proton adiabatic expansion below 100 MeV for medium-low solar activity conditions. In the work by Vos & Potgieter (2015, and references therein), the estimate of the proton adiabatic expansion was compared to the PAMELA data above 70 MeV. Unfortunately, these data were collected near solar minimum and during a negative polarity period of the GSMF with the drift effects superposed on those of adiabatic expansion. Therefore, the comparison of model and data was moderately significant. Calculations on the adiabatic expansion indicate that the proton energy spectrum between 10 and 100 MeV follows a power-law trend with a positive spectral index ranging between 1 and 1.34 (Kecskeméty et al. 2011), unless solar or interplanetary proton components (especially at solar maximum) mask this trend. In other words, only at solar minimum and during an A > 0 polarity period can the effect of the adiabatic expansion of cosmic rays below 100 MeV be studied with no significant contamination of solar and interplanetary accelerated particles. All space missions carrying instruments whose function is compromised by particles with energies exceeding tens of MeV cannot benefit from cosmic-ray flux modulation models alone, except at solar minimum. Under all other solar modulation conditions, continuous onboard measurements of the overall particle flux impacting the satellites are required. These findings would have been relevant, for instance, to the LISA Pathfinder mission, which carried particle detectors with a 70 MeV threshold for detecting variations in the integral hadron flux, while the satellite’s internal charging was associated with particles above 100 MeV (Armano et al. 2018, 2019; Grimani et al. 2020, 2025). Naturally, if the instruments are sophisticated enough to allow the precise separation of solar and galactic particles down to very low energies, the measurements are useful to study the impact on the instruments and also the propagation processes of solar and galactic particles in the inner heliosphere.
4. Solar energetic particle events: Case studies for Metis
Cosmic-ray matrices are not acquired continuously in order to limit the Metis data volume. Nevertheless, we had the possibility to follow the evolution of two intense events on July 24–26, 2023, and February 9–14, 2024, with Metis. We recall again that for EPD/HET and Metis joint observations, we had to focus on SEP events characterized by particle acceleration above 80 MeV. Therefore, the indicated duration of the SEP events is meant for the periods during which solar particles above this energy were observed.
4.1. The July 24–26, 2023, SEP event
On July 24, 2023, after 19:00 UT the overall proton flux incident on the Solar Orbiter S/C measured with the EPD/HET instrument increased rapidly by more than four orders of magnitude in the energy range 10–20 MeV and by almost three orders of magnitude between 80 and 90 MeV (see Fig. 4). Figure 5 shows the proton energy differential spectra averaged over the short time intervals indicated by the colored bars in Fig. 4. The phases of the event (onset, peak, decay) have been named following the evolution of the event in the energy bin 80–90 MeV. These energy spectra are considered in Section 7 for Monte Carlo simulations of the VL instrument used as a particle detector.
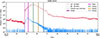 |
Fig. 4. Proton flux observed by the EPD/HET instrument on board Solar Orbiter from July 23 through August 1, 2023. The availability of Metis cosmic-ray matrices is indicated by the vertical black lines. The colored bars indicate the time intervals corresponding to the proton differential flux measurements carried out with EPD/HET shown in Fig. 5. |
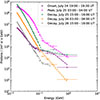 |
Fig. 5. Proton energy spectra measured by EPD/HET during the evolution of the July 24, 2023, SEP event. |
Since both space weather science and several missions may benefit from the sequence of events on the Sun leading to particle acceleration, we illustrate the solar activity associated with the observed SEP events considered in this work.
At 19:00 UT on July 24, 2023, Solar Orbiter was at 0.94 au from the Sun and at +155.8° in longitude with respect to Earth (see Fig. 6)5. A soft X-ray flux enhancement above 4 keV was observed with STIX6 (Krucker et al. 2020) on board Solar Orbiter after 17:38 UT. Due to the mutual position of the satellites, no analogous X-ray enhancement was detected with GOES near Earth. A halo CME was seen emerging with an estimated speed of 1204 km s−1 at 18:06:05 UT7 from the near west limb NOAA active region 3378 (the last position of the active region observed with near-Earth experiments was S26W56, as shown in Fig. 7). In Fig. 8 the CME appears in the STEREO A COR 28 field of view at 18:32:45 UT. Meter-wavelength type II solar radio bursts are thought to be the signatures of shock-accelerated electrons in the corona (Kumari et al. 2023). Although the active region was not in a favorable position relative to Earth, a weak type II radio burst was detected by the e-Callisto system9 above 16 MHz in the ALASKA-HAARP and MEXICO-LANCE-A stations after 18:00 UT. The onset of the SEP event above 80 MeV observed with Solar Orbiter is compatible with the proton shock acceleration associated with the CME indicated above (see details in Fig. 8).
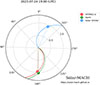 |
Fig. 6. View of the ecliptic plane from solar north on July 24, 2023, at 19:00 UT. The Parker spirals (solid colored lines) indicate the positions of Solar Orbiter (S), Earth (E), and STEREO A (A). Solar Orbiter was at 0.94 au from the Sun, at +155.8° in longitude from Earth. The image was obtained with the Solar MAgnetic Connection Haus tool (Gieseler et al. 2023). |
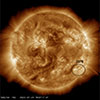 |
Fig. 7. Active region 3378 (SDO/AIA 193 Å) at 18:07:17 UT on July 24, 2023. |
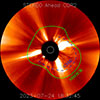 |
Fig. 8. Halo CME generated by the active region 3378 in the COR2 STEREO A field of view at 18:32:45 UT on July 24, 2023. The locations of the shock wave (green continuous line) and CME (dashed blue line) are indicated. |
4.2. The February 9-14, 2024, event
Three solar proton enhancements were observed above 80 MeV on board Solar Orbiter from February 9, 2024, through February 14, 2024, as shown in Fig. 9.
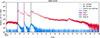 |
Fig. 9. Proton flux observed by the EPD/HET instrument on board Solar Orbiter from February 7 through February 28, 2024. Three SEP enhancements are observed above the GCR background with onsets dated February 9, February 11, and February 12. The vertical black lines and colored bars have the same meaning as in Fig. 4. |
During the whole period the proton flux never returned to the GCR background. The first onset was observed on February 9 between 13:45 UT and 14:15 UT and the first peak at 14:30–15:30 UT of the same day when Solar Orbiter was at 0.84 au from the Sun and at a longitude of −26.6° from the Earth. The position of Solar Orbiter with respect to Earth and STEREO A is indicated in Fig. 10. Two other enhancements peaking on February 11 between 00:30 and 01:30 UT and on February 12 between 16:00 UT and 17:00 UT followed the first peak. The proton energy spectra during these phases of the event are reported in Fig. 11.
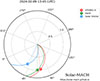 |
Fig. 10. Same as Fig. 6, but for February 9, 2024, at 13:45 UT. Solar Orbiter was at 0.84 au from the Sun and at −26.6° in longitude from the Earth. |
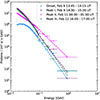 |
Fig. 11. Proton energy spectra measured by EPD/HET during the evolution of the February 9–14, 2024, SEP event. |
The evolution of this SEP event was also captured in the COR2 images on STEREO A along with solar eruptive events as can be observed in the movie available online.
On February 9, 2024, flare X3.3 started at 12:53 UT, peaked at 13:14 UT, and ended at 13:32 UT from the active region 3575 positioned in the southwest quadrant of the Sun (S37W98; left panel in Fig. 12, Li et al. 2025). An X-ray flux enhancement was observed by STIX10 in the energy range 4–25 keV between 13:25 UT and 13:45 UT. A full halo CME followed at 13:25:57 UT11 with an estimated speed of 2782 km s−1 (left panel in Fig. 13) from the same active region. A type II radio burst was detected by e-Callisto after 13:04 UT. A second partial halo CME with an estimated speed of 248 km s−1 followed at 17:00 UT (Li et al. 2025). This CME did not generate any evident proton acceleration on Solar Orbiter. The second proton flux peak was plausibly associated with an M9.04 flare from the active region 3576 starting at 22:56 UT, peaking at 23:07 UT and ending at 23:14 UT on February 11 (middle panel in Fig. 12). A halo CME was then observed at 23:36:05 UT with an estimated speed of 817 km/s (middle panel of Fig. 13). A second type II radio burst was detected by the e-Callisto system after 23:05 UT. The third proton enhancement, which shows a different evolution compared to the others, started early on February 12 and appeared associated with a series of eruptions and CMEs, the first of which associated with an M6.5 flare that started at 03:23 UT, peaking at 03:48 UT and ending at 03:53 UT from the active region 3576 (right panel in Fig. 12). A CME was observed to erupt at 06:36:05 UT from the same active region at a speed of 2792 km s−1 (right panel in Fig. 13). A type IV radio burst was detected by the e-Callisto system after 06:30 UT.
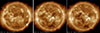 |
Fig. 12. Active regions 3575 and 3576 (SDO/AIA 193 Å) at 13:08:17 UT on February 9, 2024 (left panel); at 23:08:41 UT on February 10, 2024; and at 03:47:29 UT on February 12, 2024. |
 |
Fig. 13. Image of CMEs emitted from active regions 3575 and 3576 in the field of view of STEREO A COR2 on February 9, February 11, and February 12, 2024. |
5. REBECCA: An automated tool for particle track identification and analysis in the Metis cosmic-ray matrices
We developed a tool dedicated to the Metis cosmic-ray matrix (in original FITS format files) visualization and analysis, named REBECCA. REBECCA is written in Python, version 3.9. It relies upon the latest versions of common Python libraries (e.g., NumPy, Astropy, Matplotlib, and SciPy). The graphical user interface is implemented through the CustomTkinter library12.
The algorithms implemented in REBECCA were built on the basis of our previous experience gained with the visual analysis of several cosmic-ray matrices carried out with the APViewer (Persici 2021; Grimani et al. 2023, 2024a), where recurrent particle interaction patterns were identified.
A pre-processing algorithm is included in the tool to remove noisy pixels, i.e., single pixels always fired in all matrices and whole matrix columns presenting an anomalous number of fired pixels. The threshold to remove noisy columns was fixed to the double of P99, which is the 99th percentile of the fired pixels calculated for each column of the matrix.
The ultimate goal of REBECCA is to provide a user-friendly graphical interface for the automated search and for the visual and statistical analysis of particle tracks in the cosmic-ray matrices. Particle tracks are classified on the basis of their topology. Based on recurrent patterns found with the visual analysis, a different color is assigned to each track topology. Straight tracks (single fired pixels appearing in only one frame out of each image, shown in red), slant tracks (firing more than one pixel along the main particle track, in purple) horizontal and vertical tracks (straight tracks, both horizontal and vertical, with single pixels along the track, in green) and squares (clusters of pixels forming a square or a rectangle, typically a small slant track with possible production of δ rays, in cyan) are exemplified in Fig. 14, where a giant slant track appears magnified.
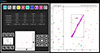 |
Fig. 14. Example of automated and visual analysis carried out with REBECCA. Left panel: four different matrices corresponding to the peak of the same SEP event are analyzed at once. The mean number of particle tracks in the sets of analyzed cosmic-ray matrices and standard deviations are reported in the bottom row of the table in the figure. Right panel: subregion of a cosmic-ray matrix is shown, after the automated analysis. By default, the last opened matrix is shown. Users can change this behavior by clicking on a different row of the table in the left panel. When dragging the mouse over the shown subregion, the corresponding matrix pixel’s coordinates are shown in the top left corner. When “Select mode” is on, it is possible to draw rectangles around tracks of interest and the corresponding coordinates are reported in the top right corner. A quick guide of REBECCA, explaining the functionalities associated with each button of the interface, is accessible through the “?” button in the main window. |
The REBECCA tool offers the possibility of opening simultaneously more than one matrix, to enable robust analyses on the basis of results averaged over different sets of matrices gathered under quasi-stationary conditions of GCRs. On the other hand, the same functionality can be exploited to monitor the evolution of SEP events by comparing the cosmic-ray matrix particle tracks observed at the onset, peak, and decay of the same event. After development, consistency checks of the REBECCA tool outcomes were performed to demonstrate that the same results were obtained with the tool and with the visual analysis carried out with the APViewer used in past.
The functionalities of REBECCA are provided in a user guide. The REBECCA code and user guide will be released upon request after adequate cross-platform testing. The Metis cosmic-ray matrices are also currently available upon request.
6. Galactic and solar particle track analysis in the Metis VL images
In this section we present the results of several analyses of particle tracks in cosmic-ray matrices to complete the monitoring of the GCR proton flux modulation above 100 MeV during the increasing part of solar cycle 25 and at its maximum when the GSMF started to reverse polarity from positive to negative. Two SEP events dated July 24–26, 2023, and February 9–14, 2024, were also studied.
The algorithm for the acquisition of cosmic-ray matrices is activated occasionally to limit the Metis data volume. Therefore, we analyzed from two to four sets of matrices depending on their availability (see Table 1). The results obtained for each set of images were averaged. We note, for consistency, that we used the same algorithm parameters in all analyses for the separation of the energy loss distributions of photons and particles. The total exposure time of cosmic-ray matrices was increased from 1 minute at solar minimum in 2020 through 7 minutes at solar maximum in 2024 during a GSMF positive polarity epoch to maintain a sufficient number of particle tracks in each image for the GCR analysis. The number of fired pixels must be kept low enough to maintain a good quality of the visual analysis. On the other hand, too few tracks would increase the statistical uncertainty on the analysis. The results have been normalized to one minute of exposure time for comparison with the analysis dated May 2020. In particular, for the analysis carried out at solar maximum in 2023–2024, reported here for the first time, each cosmic-ray matrix consisted of 28 frames with a 15 s exposure time per frame. Single, clusters, and columns of noisy pixels appearing in more than two frames of each image were neglected in this and previous analyses, as anticipated in Section 5. The fraction of noisy pixels to the total number of pixels was determined and found to be unchanged since the beginning of the mission and is equal to 5 × 10⁻⁵. The number of pixels fired by GCRs exceeds the noisy ones by approximately an order of magnitude.
Galactic cosmic-ray and SEP tracks in the Metis cosmic-ray matrices. Observations are averaged over 60 s.
The use of the REBECCA tool allowed us to shorten the time allocated in the past for visual analysis. The outcomes of the present analysis and of those carried out in 2020–2023 (Grimani et al. 2021, 2023, 2024a) appear in Table 1.
The number of tracks in the cosmic-ray matrices depends on the energy distribution of particles incident on the Solar Orbiter S/C. After the mission launch, the primary GCR proton flux above 80 MeV decreased by a factor of 3.5 (see Fig. 3), whereas the number of GCR tracks in the cosmic-ray matrices declined by less than a factor of three. During the studied July 2023 and February 2024 SEP events the overall flux of protons increased by three and two orders of magnitude above 80 MeV, respectively. The corresponding increase in the number of tracks in the Metis images was one order of magnitude smaller in both cases. This is due to the low energies of SEPs, a large number of which stop in the S/C without producing many secondary particles in the material surrounding Metis. These results are important for the estimate of the deep charging of satellites of large missions.
Interestingly, for GCRs the percentage of slant tracks compared to the total number of tracks in the cosmic-ray matrices is about 30% from solar minimum through solar maximum. This evidence is primarily associated with the isotropic spatial distribution of GCRs. Conversely, the fraction of slant tracks varies for solar particles: it ranges from 47% at the peak of the event dated July 24–26, 2023, through 35% during the decay phase. A percentage of slant tracks of about 40% was observed near the peaks of the February 9–14, 2024, SEP event. Solar energetic particles are initially anisotropic and concentrated near the interplanetary magnetic field lines, while they become more isotropic and spread over time and space due to interplanetary transport processes (Grimani et al. 2014; Moradi & Giacalone 2023). Solar Orbiter is a non-spinning, three-axis stabilized spacecraft designed to maintain a Sun-pointed orientation during its normal mission mode with Sun-facing side protected by a sunshield (see Figure 1). Therefore, its attitude does not vary with respect to the nominal direction of the Parker spiral, especially during a period of 3–5 days, typical of the duration of the SEP events studied in this paper. Our conclusion is that the different observed fraction of slant tracks is due to a varying spatial distribution of SEPs during the evolution of the events. In order to reproduce the varying spatial distribution of the SEPs observed in the cosmic-ray matrices with Monte Carlo simulations, we would need precise pitch angle and impact point estimates of the particles outside the S/C in the energy range of interest above 80 MeV. Unfortunately, EPD/HET provides a partial solid angle coverage and no pitch angle estimates for single particles are available above 300 MeV. The correct evaluation of the varying spatial distribution of SEPs is of primary importance to calculate correctly the geometrical factor of instruments detecting the incident particle flux on the S/C (Grimani et al. 2025).
7. Monte Carlo simulations of galactic and solar particles in the Metis images
The galactic cosmic-ray and SEP energy spectra reported in Figs. 3, 5, and 11 constitute the input data for Monte Carlo simulations aiming at reproducing the GCR and SEP tracks in the Metis cosmic-ray matrices of the Metis VL instrument used as a particle detector.
Number of GCR tracks in the cosmic-ray matrices of the Metis VL instrument for 60 s exposure time after the Solar Orbiter launch.
We were able to separate SEP fluxes from the GCR background above 80 MeV in order to assess the impact of these two samples of particles on the cosmic-ray matrices. It should be noted that, in the observations, both GCRs and SEPs are present. The simulated GCR and SEP tracks were not added together as no cosmic-ray matrices were available at the onset of the February 9–14, 2024, SEP event. Additionally, the cosmic-ray matrix available on February 12 was acquired before the third peak of the event as can be observed in Fig. 9.
For the Monte Carlo simulations, we adopted the CERN release of the FLUKA code (version 4.0.1)13 (Battistoni et al. 2014; Böhlen et al. 2014), which is a tool written in Fortran devoted to the calculation of particle transport and interaction with matter. The simplified geometries of the Solar Orbiter S/C and the Metis coronagraph were built with Flair (Vlachoudis 2009) for FLUKA, as shown in Fig. 15. The average amount of matter shielding the Metis VL channel is about 10 g cm−2. Protons with energies below 80 MeV do not penetrate this amount of matter, and therefore do not contribute to the generation of tracks in cosmic-ray matrices.
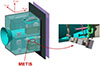 |
Fig. 15. Simplified Solar Orbiter S/C geometry for FLUKA simulations. The Solar Orbiter optical reference frame and the Metis position are indicated for comparison with Fig. 1. |
The simulation results, normalized to 60-second exposure time of cosmic-ray matrices, for GCR protons from May 2020 through February 2024 and for solar protons during the two SEP events dated July 24–26, 2023, and February 9–14, 2024, are reported in Table 2 for comparison with observations. The simulations are affected by systematic uncertainties of 10% associated with cosmic-ray proton models and 10% due to the FLUKA Monte Carlo program accuracy (Lechner et al. 2019) for a total of 14%.
Both systematic and statistical uncertainties on the simulation results are shown in the table. We find a good agreement between simulations and data within uncertainties. The solar modulation parameter was too similar in February and July 2023 to obtain different Monte Carlo simulation results within the uncertainties, and therefore we considered the same number of simulated tracks for both periods. Nuclei and other particles from GCRs also contribute to the generation of particle tracks in cosmic-ray matrices. Monte Carlo simulations indicate that the tracks produced by all particles except protons represent 35% of the total number of tracks. This is an indirect estimate of the efficiency of the algorithm implemented in the Metis electronics for particle track selection. Since the number of tracks observed in cosmic-ray matrices is numerically equal to those associated with protons alone, Metis acts as a proton monitor.
The data reported in the last row of Table 2 indicate that simulated particle tracks with primary protons only agree within uncertainties with observations. We found similar results from solar minimum through solar maximum (see also Grimani et al. 2021, 2023, 2024a).
In Table 3 we compare Monte Carlo simulations and cosmic-ray matrix data during different phases of the July 24–26, 2023, and February 9–14, 2024, SEP events. A general agreement between simulations and analysis is also observed for the SEP events, once it is properly taken into account that the analysis includes the contribution of both SEPs and GCRs, whereas the simulations account for SEPs alone. The most significant difference is observed during the late phases of SEP events, when the overall proton flux above 100 MeV decreases by several orders of magnitude and GCRs above GeV energies become the dominant contributors to the tracks recorded in the cosmic-ray matrices.
In Table 4 we report the composition of particles of galactic and solar origin impacting on the Solar Orbiter S/C and the Monte Carlo estimated composition of secondary particles, crossing the images of Metis surrounded by an average of more than 10 g/cm2 of material only with incident protons. The percentage of galactic protons to the total number of particles decreases from about 80% through 70% with increasing solar activity, plausibly due to a smaller number of low-energy particles that do not interact in the S/C. The contribution of other incident particles than protons would not change these main conclusions on particle composition.
Percentages of different particle species crossing the Metis VL images in comparison to incident GCRs from solar minimum through solar maximum and SEPs.
Finally, since SEP particles mainly consist of protons with energy below hundreds of megaelectron volts, during SEP events only protons and a small percentage of electrons cross the Metis images regardless of the phase of the SEP events.
8. Conclusions
The contemporaneous observations of GCRs and SEPs gathered with EPD/HET outside the Solar Orbiter S/C and with the VL instrument of the Metis coronagraph below more than 10 g/cm2 of S/C and instrument material allowed us to show that the performance of the VL channel did not change during the first five years of the mission (2020–2024). The noisy pixels in the VL images were found to constitute a fraction of about 5 × 10⁻⁵ of the total number of pixels during the whole mission duration. The percentage of pixels fired in the sensitive part of the VL instrument by GCRs was approximately one order of magnitude higher, with an absolute number of pixels fired by high-energy particles that decreased by almost a factor of three (from 271 through 102 in a 60-second exposure time) above 80 MeV, due to the increasing solar modulation during a positive polarity epoch of the GSMF. Between 10 and 100 MeV, an increasing component of interplanetary particles incident on the Solar Orbiter S/C was observed to overcome the galactic proton depression associated with adiabatic energy losses in the heliosphere. These findings will be compared with those gathered under similar conditions of solar activity during the extended phase of the mission during a negative polarity of the GSMF and out of the ecliptic at distances smaller than 1 au from the Sun. Only a very limited number of these observations were gathered in the past under similar conditions.
The evolution of two SEP events dated July 24–26, 2023, and February 9–14, 2024, characterized by particle acceleration above 80 MeV was also studied. Our analysis of GCRs and SEP events allowed us to show that GCRs, presenting an isotropic spatial distribution, constitute up to about 30% of slant tracks in the Metis images, while during the early phases of SEP events the fraction of slant tracks increased up to about 50% depending on the magnetic connection between the active region at the origin of the particle acceleration and the S/C position.
Monte Carlo simulations of the Metis VL instrument performance were carried out by using as input data the overall proton flux of protons incident on the S/C measured in situ by the EPD/HET instrument. The particle composition outside and deep inside the satellite were compared. It was found that protons crossing the camera of the Metis VL instrument decreased from 80% at solar minimum through 70% at solar maximum, while the percentage of secondary particles produced in the satellite increased progressively from solar minimum through solar maximum. For SEPs a constant percentage of 92% protons and 8% electrons was estimated for all phases of the events. This work is of interest to other missions for which dose absorption and instrument particle charging may represent a limitation to their sensitivity.
9. Data availability
Movie is available at https://www.aanda.org
Acknowledgments
Solar Orbiter is a space mission of international collaboration between ESA and NASA, operated by ESA. The Metis program is supported by the Italian Space Agency (ASI) under the contracts to the co-financing National Institute of Astrophysics (INAF): Accordi ASI-INAF N. I-043-10-0 and Addendum N. I-013-12-0/1, Accordo ASI-INAF N.2018-30-HH.0 and under the contracts to the industrial partners OHB Italia SpA, Thales Alenia Space Italia SpA and ALTEC: ASI-TASI N. I-037-11-0 and ASI-ATI N. 2013-057-I.0. Metis was built with hardware contributions from Germany (Bundesministerium für Wirtschaft und Energie (BMWi) through the Deutsches Zentrum für Luft- und Raumfahrt e.V. (DLR)), from the Academy of Science of the Czech Republic (PRODEX) and from ESA. The EPD/HET data up to 100 MeV are publicly available on the Solar Orbiter Archive (SOAR; https://soar.esac.esa.int/soar/). The data above 100 MeV were kindly provided by the EPD/HET collaboration as a private communication. We also thank the EPD/HET collaboration for useful discussions about proton observations gathered on board Solar Orbiter and the PHI and EUI Collaborations for providing useful details about instrument geometries for S/C simulations. Finally, we are very grateful to Simone Benella of the Institute for Space Astrophysics and Planetology (INAF-IAPS, Italy) for useful discussions.
References
- Andretta, V., Bemporad, A., Focardi, M., et al. 2014, in Software and Cyberinfrastructure for Astronomy III, SPIE Conf. Ser., 9152, 91522Q [NASA ADS] [CrossRef] [Google Scholar]
- Antonucci, E., Romoli, M., Andretta, V., et al. 2020, A&A, 642, A10 [NASA ADS] [CrossRef] [EDP Sciences] [Google Scholar]
- Araújo, H. M., Wass, P., Shaul, D., et al. 2005, Astr. Phys., 22, 451 [NASA ADS] [CrossRef] [Google Scholar]
- Armano, M., Audley, H., Baird, J., et al. 2018, ApJ, 854, 113 [NASA ADS] [CrossRef] [Google Scholar]
- Armano, M., Audley, H., Baird, J., et al. 2019, ApJ, 874, 167 [NASA ADS] [CrossRef] [Google Scholar]
- Barnes, C. W., & Simpson, J. A. 1976, ApJ, 210, L91 [Google Scholar]
- Battistoni, G., Boehlen, T., Cerutti, F., et al. 2014, Joint International Conference on Supercomputing in Nuclear Applications + Monte Carlo, 06005 [Google Scholar]
- Boella, G., et al. 2001, J. Geophys. Res., 106, 355 [Google Scholar]
- Böhlen, T. T., Cerutti, F., Chin, M. P. W., et al. 2014, Nucl. Data Sheets, 120, 211 [CrossRef] [Google Scholar]
- Brehm, N., Bayliss, A., Christl, M., et al. 2021, Nat. Geosci., 14, 10 [Google Scholar]
- Burger, R. A., Potgieter, M. S., & Heber, B. 2000, J. Geophys. Res.: Space Phys., 105, 27447 [NASA ADS] [CrossRef] [Google Scholar]
- Christl, M., Adams, Jr., J. H., Kuznetsov, E. N., et al. 2009, International Cosmic Ray Conference [Google Scholar]
- Clette, F., Svalgaard, L., Vaquero, J. M., & Cliver, E. W. 2014, Space Sci. Rev., 186, 35 [CrossRef] [Google Scholar]
- Corti, C., Potgieter, M. S., Bindi, V., et al. 2019, ApJ, 871, 253 [NASA ADS] [CrossRef] [Google Scholar]
- De Simone, N., Di Felice, V., Gieseler, J., et al. 2011, Astrophys. Space Sci. Trans., 7, 425 [Google Scholar]
- Desai, M. I., Marsden, R. G., Sanderson, T. R., et al. 1998, J. Geophys. Res.: Space Phys., 103, 2003 [Google Scholar]
- Dimiccoli, F., Dolesi, R., Fabi, M., et al. 2025, A&A, 700, A102 [NASA ADS] [CrossRef] [EDP Sciences] [Google Scholar]
- Fineschi, S., Naletto, G., Romoli, M., et al. 2020, Exp. Astron., 49, 239 [Google Scholar]
- García Marirrodriga, C., Pacros, A., Strandmoe, S., et al. 2021, A&A, 646, A121 [CrossRef] [EDP Sciences] [Google Scholar]
- Giacalone, J., Jokipii, J. R., & Kóta, J. 2002, ApJ, 573, 845 [Google Scholar]
- Gieseler, J., Dresing, N., Palmroos, C., et al. 2023, Front. Astron. Space Sci., 9 [Google Scholar]
- Gleeson, L. J., & Axford, W. I. 1968, ApJ, 154, 1011 [NASA ADS] [CrossRef] [Google Scholar]
- Grimani, C. 2004, A&A, 418, 649 [NASA ADS] [CrossRef] [EDP Sciences] [Google Scholar]
- Grimani, C. 2007, A&A, 474, 339 [NASA ADS] [CrossRef] [EDP Sciences] [Google Scholar]
- Grimani, C., Fabi, M., Finetti, N., & Tombolato, D. 2008, Int. Cosmic Ray Conf., 1, 485 [NASA ADS] [Google Scholar]
- Grimani, C., Fabi, M., Finetti, N., Laurenza, M., & Storini, M. 2013, J. Phys. Conf. Ser., 409, 012159 [NASA ADS] [CrossRef] [Google Scholar]
- Grimani, C., Ao, X., Fabi, M., et al. 2014, Class. Quant. Grav., 31, 045018 [Google Scholar]
- Grimani, C., Cesarini, A., Fabi, M., et al. 2020, ApJ, 904, 64 [NASA ADS] [CrossRef] [Google Scholar]
- Grimani, C., Andretta, V., Chioetto, P., et al. 2021, A&A, 656, A15 [NASA ADS] [CrossRef] [EDP Sciences] [Google Scholar]
- Grimani, C., Villani, M., Fabi, M., Cesarini, A., & Sabbatini, F. 2022, A&A, 666, A38 [NASA ADS] [CrossRef] [EDP Sciences] [Google Scholar]
- Grimani, C., Andretta, V., Antonucci, E., et al. 2023, A&A, 677, A45 [NASA ADS] [CrossRef] [EDP Sciences] [Google Scholar]
- Grimani, C., Fabi, M., Persici, A., et al. 2024a, A&A, 686, A74 [NASA ADS] [CrossRef] [EDP Sciences] [Google Scholar]
- Grimani, C., Villani, M., Fabi, M., & Sabbatini, F. 2024b, J. High Energy Astrophys., 42, 38 [Google Scholar]
- Grimani, C., Fabi, M., Sabbatini, F., & Villani, M. 2025, Class. Quant. Grav., 42, 095009 [Google Scholar]
- Kecskeméty, K., Logachev, Y. I., Zeldovich, M. A., & Kóta, J. 2011, ApJ, 738, 173 [Google Scholar]
- Krucker, S., Hurford, G. J., Grimm, O., et al. 2020, A&A, 642, A15 [NASA ADS] [CrossRef] [EDP Sciences] [Google Scholar]
- Kumari, A., Morosan, D. E., Kilpua, E. K. J., & Daei, F. 2023, A&A, 675, A102 [NASA ADS] [CrossRef] [EDP Sciences] [Google Scholar]
- Lario, D. 2005, Adv. Space Res., 36, 2279 [Google Scholar]
- Laurenza, M., Consolini, G., Storini, M., & Damiani, A. 2015, J. Phys., Conf. Ser., 632, 012066 [Google Scholar]
- Laurenza, M., Vecchio, A., Storini, M., & Carbone, V. 2014, ApJ, 781, 71 [Google Scholar]
- Lechner, A., Auchmann, B., Baer, T., et al. 2019, Phys. Rev. Accel. Beams, 22, 071003 [CrossRef] [Google Scholar]
- Li, S.-Y., Zhang, Q.-M., Ying, B.-L., et al. 2025, Res. Astron. Astrophys., 25, 015006 [Google Scholar]
- Martucci, M., Ammendola, R., Badoni, D., et al. 2023, ApJ, 945, L39 [Google Scholar]
- McDonald, F. B., Teegarden, B. J., Trainor, J. H., von Rosenvinge, T. T., & Webber, W. R. 1976, ApJ, 203, L149 [Google Scholar]
- Moradi, A., & Giacalone, J. 2023, ApJ, 952, 153 [Google Scholar]
- Müller, D., St. Cyr, O. C., Zouganelis, I., et al. 2020, A&A, 642, A1 [Google Scholar]
- Papini, P., Grimani, C., & Stephens, S. 1996, Nuovo Cim. C, 19, 367 [NASA ADS] [CrossRef] [Google Scholar]
- Pence, W. D., Chiappetti, L., Page, C. G., Shaw, R. A., & Stobie, E. 2010, A&A, 524, A42 [NASA ADS] [CrossRef] [EDP Sciences] [Google Scholar]
- Persici, A. 2021, University of Urbino Carlo Bo Thesis [Google Scholar]
- Potgieter, M., Mwiinga, N., Ferreira, S., Manuel, R., & Ndiitwani, D. 2013, J. Adv. Res., 4, 259 [Google Scholar]
- Potgieter, M. S., & Langner, U. W. 2004, ApJ, 602, 993 [Google Scholar]
- Reames, D. V. 2021, Gradual SEP Events (Cham: Springer International Publishing), 97 [Google Scholar]
- Rodríguez-Pacheco, J., Wimmer-Schweingruber, R. F., Mason, G. M., et al. 2020, A&A, 642, A7 [Google Scholar]
- Romoli, M., Antonucci, E., Andretta, V., et al. 2021, A&A, 656, A32 [NASA ADS] [CrossRef] [EDP Sciences] [Google Scholar]
- Schühle, U., Teriaca, L., Aznar Cuadrado, R., et al. 2018, in Space Telescopes and Instrumentation 2018: Ultraviolet to Gamma Ray, eds. J. W. A. den Herder, S. Nikzad, & K. Nakazawa, SPIE Conf. Ser., 10699, 1069934 [Google Scholar]
- Simpson, J. A. 1983, Ann. Rev. Nucl. Part. Sci., 33, 323 [NASA ADS] [CrossRef] [Google Scholar]
- Strauss, R. D., Potgieter, M. S., Kopp, A., & Büsching, I. 2011, J. Geophys. Res. (Space Physics), 116, A12105 [Google Scholar]
- Sullivan, J. 1971, Nucl. Instrum. Methods, 95, 5 [Google Scholar]
- Telloni, D., Fabi, M., Grimani, C., & Antonucci, E. 2016, in Solar Wind, AIP Conf. Ser., 1720, 100001 [Google Scholar]
- Tsurutani, B. T., Burton, M. E., Smith, E. J., & Jones, D. E. 1987, Planet. Space Sci., 35, 289 [Google Scholar]
- Uslenghi, M., Schühle, U. H., Teriaca, L., Heerlein, K., & Werner, S. 2017, in SPIE Conf. Ser., ed. O. H. Siegmund, 10397, 103971K [NASA ADS] [Google Scholar]
- Usoskin, I. G., Bazilevskaya, G. A., & Kovaltsov, G. A. 2011, J. Geophys. Res. (Space Physics), 116, A02104 [Google Scholar]
- Usoskin, I. G., Gil, A., Kovaltsov, G. A., Mishev, A. L., & Mikhailov, V. V. 2017, J. Geophys. Res. (Space Physics), 122, 3875 [Google Scholar]
- Vlachoudis, V. 2009, in International Conference on Mathematics, Computational Methods& Reactor Physics (M&C 2009) (New York: Saratoga Springs), 790 [Google Scholar]
- Vos, E. E., & Potgieter, M. S. 2015, ApJ, 815, 119 [NASA ADS] [CrossRef] [Google Scholar]
- Wang, M., Chen, B., Knuth, T., et al. 2025, ApJ, 983, 33 [Google Scholar]
- Wass, P. J., Sumner, T. J., Araújo, H. M., & Hollington, D. 2023, Phys. Rev. D, 107, 022010 [Google Scholar]
- Zhu, C.-R., Yuan, Q., & Wei, D.-M. 2021, Astropart. Phys., 124, 102495 [Google Scholar]
Flexible Image Transport System is a widely used portable and self-describing standard for astronomical images (Pence et al. 2010).
Data up to 100 MeV are available on https://soar.esac.esa.int/soar/. Data above 100 MeV were kindly provided by the EPD/HET Collaboration.
Data used here are publicly available at http://www.sidc.be/silso/datafiles
All Tables
Galactic cosmic-ray and SEP tracks in the Metis cosmic-ray matrices. Observations are averaged over 60 s.
Number of GCR tracks in the cosmic-ray matrices of the Metis VL instrument for 60 s exposure time after the Solar Orbiter launch.
Percentages of different particle species crossing the Metis VL images in comparison to incident GCRs from solar minimum through solar maximum and SEPs.
All Figures
|
Fig. 1. Sketch of the Solar Orbiter S/C. The positions of the Metis coronagraph and of the two units of the EPD/HET instrument are indicated by red arrows. XORF, YORF, ZORF indicate the Solar Orbiter optical reference frame. Image credit: European Space Agency. |
| In the text | |
|
Fig. 2. Monthly sunspot number and solar modulation parameter from February 2020 through December 2024. The stars within circles indicate the periods during which the past and present GCR and SEP analyses were carried out (Grimani et al. 2021, 2023, 2024a). |
| In the text | |
|
Fig. 3. EPD/HET proton data after the Solar Orbiter launch (colored stars). The top dotted line represents the adopted interstellar proton energy spectrum gathered from Burger et al. (2000). The triple-dot-dashed line, the double-dot-dashed line, the dot-dashed line, the dashed line, and the continuous line correspond to the proton energy spectra estimated in the force-field approximation of solar modulation for the indicated periods. |
| In the text | |
|
Fig. 4. Proton flux observed by the EPD/HET instrument on board Solar Orbiter from July 23 through August 1, 2023. The availability of Metis cosmic-ray matrices is indicated by the vertical black lines. The colored bars indicate the time intervals corresponding to the proton differential flux measurements carried out with EPD/HET shown in Fig. 5. |
| In the text | |
|
Fig. 5. Proton energy spectra measured by EPD/HET during the evolution of the July 24, 2023, SEP event. |
| In the text | |
|
Fig. 6. View of the ecliptic plane from solar north on July 24, 2023, at 19:00 UT. The Parker spirals (solid colored lines) indicate the positions of Solar Orbiter (S), Earth (E), and STEREO A (A). Solar Orbiter was at 0.94 au from the Sun, at +155.8° in longitude from Earth. The image was obtained with the Solar MAgnetic Connection Haus tool (Gieseler et al. 2023). |
| In the text | |
|
Fig. 7. Active region 3378 (SDO/AIA 193 Å) at 18:07:17 UT on July 24, 2023. |
| In the text | |
|
Fig. 8. Halo CME generated by the active region 3378 in the COR2 STEREO A field of view at 18:32:45 UT on July 24, 2023. The locations of the shock wave (green continuous line) and CME (dashed blue line) are indicated. |
| In the text | |
|
Fig. 9. Proton flux observed by the EPD/HET instrument on board Solar Orbiter from February 7 through February 28, 2024. Three SEP enhancements are observed above the GCR background with onsets dated February 9, February 11, and February 12. The vertical black lines and colored bars have the same meaning as in Fig. 4. |
| In the text | |
|
Fig. 10. Same as Fig. 6, but for February 9, 2024, at 13:45 UT. Solar Orbiter was at 0.84 au from the Sun and at −26.6° in longitude from the Earth. |
| In the text | |
|
Fig. 11. Proton energy spectra measured by EPD/HET during the evolution of the February 9–14, 2024, SEP event. |
| In the text | |
|
Fig. 12. Active regions 3575 and 3576 (SDO/AIA 193 Å) at 13:08:17 UT on February 9, 2024 (left panel); at 23:08:41 UT on February 10, 2024; and at 03:47:29 UT on February 12, 2024. |
| In the text | |
|
Fig. 13. Image of CMEs emitted from active regions 3575 and 3576 in the field of view of STEREO A COR2 on February 9, February 11, and February 12, 2024. |
| In the text | |
|
Fig. 14. Example of automated and visual analysis carried out with REBECCA. Left panel: four different matrices corresponding to the peak of the same SEP event are analyzed at once. The mean number of particle tracks in the sets of analyzed cosmic-ray matrices and standard deviations are reported in the bottom row of the table in the figure. Right panel: subregion of a cosmic-ray matrix is shown, after the automated analysis. By default, the last opened matrix is shown. Users can change this behavior by clicking on a different row of the table in the left panel. When dragging the mouse over the shown subregion, the corresponding matrix pixel’s coordinates are shown in the top left corner. When “Select mode” is on, it is possible to draw rectangles around tracks of interest and the corresponding coordinates are reported in the top right corner. A quick guide of REBECCA, explaining the functionalities associated with each button of the interface, is accessible through the “?” button in the main window. |
| In the text | |
|
Fig. 15. Simplified Solar Orbiter S/C geometry for FLUKA simulations. The Solar Orbiter optical reference frame and the Metis position are indicated for comparison with Fig. 1. |
| In the text | |
Current usage metrics show cumulative count of Article Views (full-text article views including HTML views, PDF and ePub downloads, according to the available data) and Abstracts Views on Vision4Press platform.
Data correspond to usage on the plateform after 2015. The current usage metrics is available 48-96 hours after online publication and is updated daily on week days.
Initial download of the metrics may take a while.