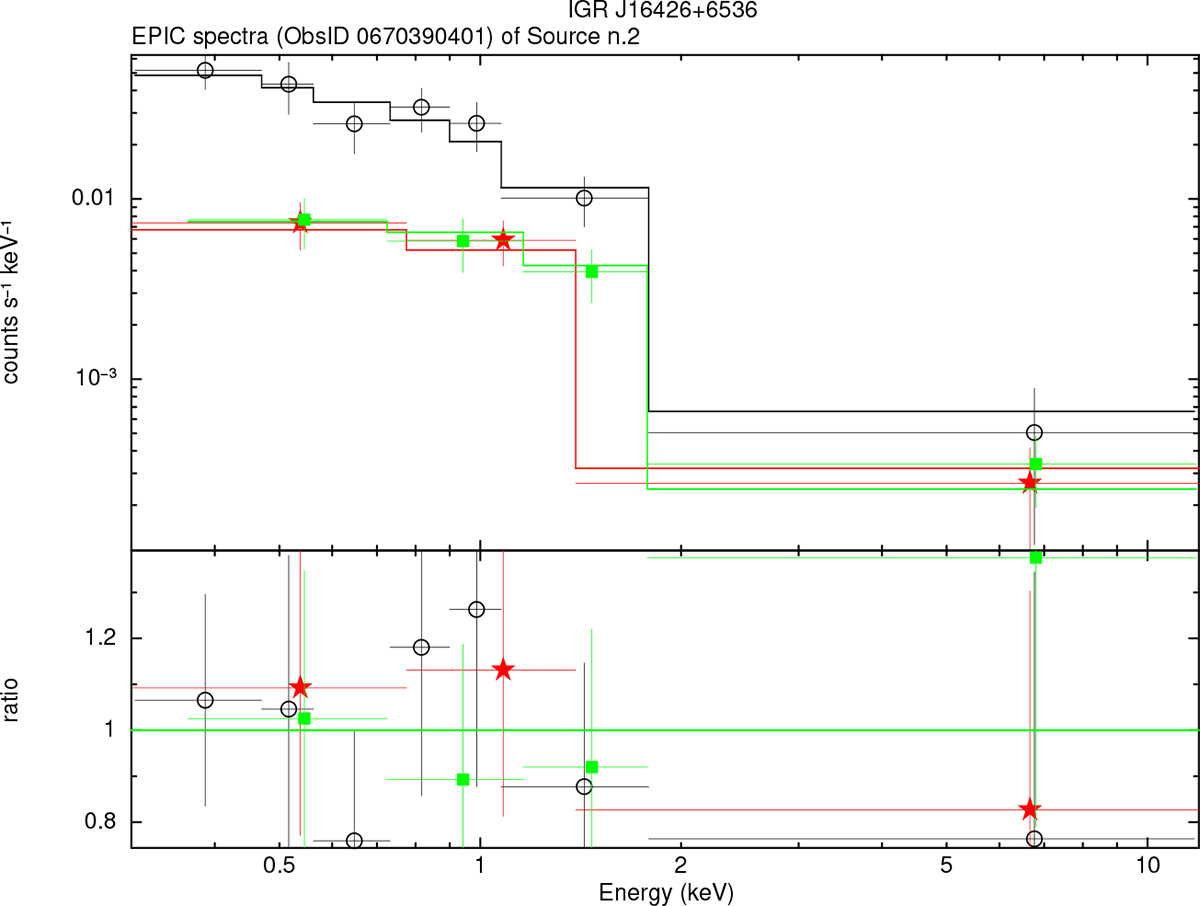
Fig. A.2.
Download original image
XMM–Newton EPIC spectra of X-ray source n.2 (ObsID 0670390401) counterpart of IGR J16426+6536. The top panel shows the data fit with an absorbed power law model, while the bottom panel the ratio of the data to the model. Open (black) circles mark the pn spectrum, solid (red) stars indicates the MOS 1 spectrum and solid (green) squares mark the MOS 2 data points. The spectra have been severely binned for graphical purposes only.
Current usage metrics show cumulative count of Article Views (full-text article views including HTML views, PDF and ePub downloads, according to the available data) and Abstracts Views on Vision4Press platform.
Data correspond to usage on the plateform after 2015. The current usage metrics is available 48-96 hours after online publication and is updated daily on week days.
Initial download of the metrics may take a while.