| Issue |
A&A
Volume 705, January 2026
|
|
|---|---|---|
| Article Number | A7 | |
| Number of page(s) | 13 | |
| Section | Astrophysical processes | |
| DOI | https://doi.org/10.1051/0004-6361/202556658 | |
| Published online | 23 December 2025 | |
Recasting the nature of INTEGRAL hard X-ray transients previously classified as active galactic nuclei
1
INAF–OAS, Osservatorio di Astrofisica e Scienza dello Spazio, Area della Ricerca del CNR, via Gobetti 101, I-1-40129 Bologna, Italy
2
INAF–IASF, Istituto di Astrofisica Spaziale e Fisica Cosmica, via A. Corti 12, 20133 Milano, Italy
★ Corresponding author: This email address is being protected from spambots. You need JavaScript enabled to view it.
Received:
30
July
2025
Accepted:
3
October
2025
Abstract
We present new broad-band X-ray results aimed at the identification and characterization of four poorly studied hard X-ray transients discovered by INTEGRAL: IGR J16426+6536, IGR J09446−2636, IGR J21268+6203, and IGR J02447+7046. The key properties and X-ray behavior of these sources have remained largely unknown until now. We investigated the temporal, spectral, and energetic characteristics of their hard X-ray outbursts detected above 20 keV by INTEGRAL. In addition, we performed a systematic analysis of unpublished archival soft X-ray observations below 10 keV, enabling a full exploration of their large INTEGRAL error circles in order to search for the most likely soft X-ray counterparts. Within their arcsecond-sized X-ray error circles, we identified single optical/near-infrared counterparts for each source. We analyzed their photometric properties to constrain the nature of the systems. Our results show that the X-ray properties of these four transients are inconsistent with the previously proposed extragalactic AGN origin and instead support a Galactic nature for all of them. Specifically, we propose a very faint X-ray transient classification for IGR J16426+6536, a nearby flaring star for IGR J09446−2636 and IGR J21268+6203, and finally a γ-ray binary nature for IGR J02447+7046.
Key words: X-rays: binaries / X-rays: stars
© The Authors 2025
 Open Access article, published by EDP Sciences, under the terms of the Creative Commons Attribution License (https://creativecommons.org/licenses/by/4.0), which permits unrestricted use, distribution, and reproduction in any medium, provided the original work is properly cited.
This article is published in open access under the Subscribe to Open model. This email address is being protected from spambots. You need JavaScript enabled to view it. to support open access publication.
1. Introduction
From its launch in 2002 and over its long mission ending in February 2025, the INTEGRAL observatory (Winkler et al. 2003) played a key role in exploring the hard X-ray transient sky above 20 keV. Over the past two decades, several INTEGRAL/IBIS catalogs have been published, listing hundreds of hard X-ray transients in the energy range 20–100 keV (e.g., Bird et al. 2007, 2010, 2016; Krivonos et al. 2022, 2018). Most transients are Galactic because of INTEGRAL’s extensive coverage of the Galactic plane.
Bird et al. (2010, 2016) introduced the bursticity method, which optimizes detection timescales by scanning INTEGRAL/IBIS light curves with variable-sized time windows in order to maximize source significance. The duration and time interval over which the source significance is maximized are then recorded. This technique has proven to be highly effective, enabling the recovery of dozens of transient sources that would have otherwise been missed. The transients listed in Bird et al. (2016) form a heterogeneous sample with durations ranging from hours to months. However, most remain poorly studied, as the catalogs provide only basic information (e.g., position, average flux, error circle radius), making them ideal candidates for follow-up multiwavelength studies.
To deepen our understanding of these underexplored transients, we have conducted a systematic study using INTEGRAL data (E > 20 keV) and soft X-ray data (E < 10 keV). Among the transients under investigation, our attention has been caught by four hard X-ray transients classified as active galactic nuclei (AGNs) in the literature: IGR J16426+6536, IGR J09446−2636, IGR J21268+6203, and IGR J02447+7046. Their temporal and spectral properties in both hard and soft X-rays are largely unknown. In particular, their AGN classification is not robust since a comprehensive study of their nature is still lacking. In fact, no systematic search has been carried out to identify the most likely soft X-ray counterparts of these sources, an essential step to reduce the large positional uncertainty associated with their hard X-ray detections (error circle radii in the range 4′–5′, see Table 1). This search requires observations below 10 keV with the X-ray telescopes carried by the Neil GehrelsSwift satellite (hereafter Swift; Gehrels et al. 2004) or XMM–Newton (Jansen et al. 2001). Such soft X-ray observations are essential to i) pinpoint the soft X-ray counterpart, ii) reduce the positional uncertainty to arcsecond accuracy, and iii) enable optical/infrared counterpart identification and classification. In the following, we summarize the main properties of these four INTEGRAL hard X-ray sources as known to date.
Characteristics of the INTEGRAL sources.
Discovered with the bursticity method and listed in the latest IBIS catalog of Bird et al. (2016), IGRJ16426+6536 is a hard X-ray transient located off the Galactic plane (b ∼ 38°). Ibarra et al. (2008) cross correlated the first XMM–Newton slew survey (Saxton et al. 2008) with the INTEGRAL large positional uncertainty region (∼5′ radius), finding the source XMMLS1 J164303.7+653253 along with two additional ROSAT sources. However, without a targeted soft X-ray observation of IGRJ16426+6536 covering its entire error circle, the exact counterpart remained unconfirmed. Despite this uncertainty, Parisi et al. (2008) proposed XMMLS1 J164303.7+653253 as a possible X-ray counterpart mainly because of the low estimated false detection probability of a random XMM–Newton source within the IBIS error circle of IGR J16426+6536 (Ibarra et al. 2008). Spectroscopy analysis of the brightest optical USNO source within the 8″ (1σ) XMM–Newton error circle (among the two optical objects present) revealed a narrow-line Seyfert 1 AGN nature with redshift z = 0.323 (Parisi et al. 2008; Masetti et al. 2009). Butler et al. (2009) came to a similar conclusion from their spectroscopic analysis, although they identified it as a Seyfert 1.5. Because of this, in the literature IGR J16426+6536 has been assumed to be an AGN and as such considered for AGN population studies (Panessa et al. 2011; Molina et al. 2013). However, the proposed AGN classification remains highly uncertain.
IGRJ09446−2636 is a hard X-ray source located off the Galactic plane (b ∼ 20°). It was first reported in the IBIS survey by Krivonos et al. (2007), and it is also listed in the IBIS catalog of Bird et al. (2016) as a transient source detected with the bursticity method. Krivonos et al. (2007) and Sazonov et al. (2007) cross correlated the INTEGRAL error circle (5 4 radius) with the ROSAT catalog and proposed the X-ray source 1RXS J094436.5−263353 as a counterpart. Based on the optical spectrum from the 6dFGS archive, the ROSAT source was classified as a Seyfert 1 AGN with redshift z = 0.14 (Masetti et al. 2008; Krivonos et al. 2007; Sazonov et al. 2007). Clearly, the proposed AGN nature of IGRJ09446−2636 remains tentative. To date, no soft X-ray investigation of its large INTEGRAL error circle has been performed; hence, the true counterpart is still unconfirmed.
IGR J21268+6203 is a hard X-ray transient discovered with the bursticity method and listed in the IBIS catalog of Bird et al. (2016). Its X-ray properties are unknown, it has an error circle radius of 4 3, and it lies slightly off the Galactic plane (b ∼ 8°). Maiorano et al. (2011) cross correlated the INTEGRAL large positional uncertainty with infrared and radio catalogs. Among the many sources found inside of it, they arbitrarily considered as candidate counterparts two unidentified sources, one radio and one infrared, separated by 24″. Maiorano et al. (2011) proposed a candidate AGN nature for IGR J21268+6203 based on their radio flux and infrared photometry, respectively. However, the true X-ray counterpart is still unconfirmed since no soft X-ray investigation of the entire INTEGRAL error circle has been performed to date.
IGR J02447+7046 is a hard X-ray transient discovered with the bursticity method and listed in the latest IBIS catalog of Bird et al. (2016). Its detailed X-ray properties remain unknown. The source is located slightly off the Galactic plane (b ∼ 10°), with an error circle radius of 5 45 (90% confidence). Masetti et al. (2013) cross correlated the INTEGRAL large error circle at a 99% confidence (6
 8 radius) with X-ray and radio catalogs. Among the many sources found inside of it, they arbitrarily selected as a counterpart a source located on the edge of the large error circle. Optical spectroscopy classified it as a Seyfert 1.2 AGN with z = 0.306. However, this proposed AGN classification remains tentative since no soft X-ray investigation of the error circle region of IGR J02447+7046 has been performed to date.
In this paper, we present new broad-band X-ray results aimed at the identification and characterization of such poorly studied hard X-ray transients. We describe the X-ray observations and the data reduction in Section 2, report the results in Section 3 and the discussion in Section 4.
2. Observations and data reduction
In the following, we underline the X-ray missions and data used to study the four hard X-ray sources. We checked that no other X-ray data from additional X-ray missions are available.
2.1. INTEGRAL
Although the four IGR sources are included in the IBIS catalog (Bird et al. 2016), a dedicated re-analysis of the INTEGRAL archival data is required to extend the temporal baseline of the hard X-ray light curves from satellite revolution 1000 (2010) to revolution 2000 (2018) and to derive their spectra.
The temporal and spectral behavior of the four hard X-ray transients was investigated above 20 keV using the ISGRI detector (Lebrun et al. 2003), the lower energy layer of the IBIS coded-mask telescope (Ubertini et al. 2003) on board INTEGRAL (Winkler et al. 2003), which operates in the energy range 15 keV −1 MeV. INTEGRAL observations are divided into short pointings, or Science Windows (ScWs), with each typically lasting ∼2000 seconds.
The IBIS/ISGRI public data archive (revolutions 30 to 2000; January 2003 to September 2018) was systematically searched for hard X-ray activity from the four transients. IBIS/ISGRI flux maps were generated for each ScW in several energy bands (18–60 keV, 17–30 keV, 20–40 keV) using the latest Offline Scientific Analysis software (OSA 11.2). Count rates at the source positions were extracted from individual ScW maps to build long-term light curves with a time bin of ∼2000 s. To systematically search for transient hard X-ray activity, we applied the bursticity method (Bird et al. 2010, 2016), which optimizes the detection timescale by scanning the IBIS/ISGRI light curves with variable-sized time windows to identify the highest source significance, on timescales ranging from 0.5 days to months and/or years. For each outburst detected, this analysis automatically provides its time interval and energy band of maximum significance. As a next step, we performed a targeted analysis of each recorded outburst by extracting and analysing the spectrum (a systematic uncertainty of 1% was added to all extracted IBIS/ISGRI spectra) as well as by constraining the outburst duration through investigation of the source light curve. To this latter aim, the dataset includes only ScWs where the sources were within the instrument field of view (FoV) at an off-axis angle of less than 12° to avoid systematic errors due to poor response modeling at large off-axis angles.
2.2. XMM–Newton
The XMM–Newton data were reprocessed using version 21 of the Science Analysis Software (SAS), following standard data reduction procedures, and using the appropriate calibration files. Response matrix files (RMFs) and ancillary response files (ARFs) were generated using the SAS tasks rmfgen and arfgen, respectively. Background spectra were extracted from source-free regions in close proximity to the target position. Event pattern selections were applied as follows: patterns 0–4 for the European Photon Imaging Camera (EPIC-pn) and 0–12 for the Metal Oxide Semi-conductor camersa (MOS).
Spectral fitting of the EPIC (pn, MOS1, MOS2) data was performed simultaneously using XSPEC (Arnaud 1996). Interstellar absorption was modeled using the TBabs model, with photoelectric cross sections from Verner et al. (1996) and elemental abundances from Wilms et al. (2000). Spectral uncertainties were estimated at the 90% confidence level. Uncertainties on X-ray fluxes were estimated using the cflux convolution model in XSPEC. Cash statistics (Cash 1979) (as implemented in XSPEC) was adopted in spectral fitting. Table 2 reports the summary of the observations analyzed here.
Summary of XMM–Newton observations.
2.3. The Swift observatory
The observational data performed by the X-Ray Telescope (XRT; Burrows et al. 2005) on board the Swift Observatory (Gehrels et al. 2004) were retrieved from the High Energy Astrophysics Science Archive Research Center (HEASARC) and processed using standard reduction procedures with the XRTPIPELINE tool. Table 3 reports the summary of the observations analyzed here. Cash statistics (Cash 1979) (as implemented in XSPEC) were adopted in the spectral fitting. Upper limits were estimated using the tool SOSTA in XIMAGE on the XRT sky images together with their appropriate exposure maps.
Summary of the Swift/XRT observations.
3. Data analysis and results
3.1. IGR J16426+6536
3.1.1. Hard X-ray observations
From our analysis of the 15 years of IBIS/ISGRI archive data using the bursticity method, we found that IGR J16426+6536 was detected in outburst only once. The hard X-ray activity began on 22 June 2004 at approximately 02:30 UTC (satellite revolution 206). The source remained within the IBIS/ISGRI FoV until 22 June 2004 at 19:15 UTC (effective exposure of 9.5 ks). It was best detected in the 20–40 keV energy band, with a significance of ∼5.5σ. The average X-ray flux was 8.4 ± 1.5 mCrab (20–40 keV). Unfortunately, the IBIS/ISGRI temporal coverage of the outburst is limited, as the source moved out of the FoV after 22 June 2004. When it re-entered the FoV about five months later, on 21 November 2004 during revolution 257, it was no longer active, as no significant detection was achieved (20–40 keV). Therefore the duration of the outburst can be constrained to be in the range of 1–150 days, contrary to a previous report in the literature that estimated it as only 0.7 days (Bird et al. 2016). Hence, the INTEGRAL detection likely corresponds to the rising phase of the outburst.
We extracted the average IBIS/ISGRI spectrum of the source during the outburst. The best fit was obtained using a power law model ( , 4 d.o.f.) with a photon index of Γ = 2.8 ± 1.5. The average 18–60 keV (20–40 keV) flux is 5.5 × 10⁻¹¹ erg cm−2 s−1 (3.5 × 10⁻¹¹ erg cm−2 s−1).
3.1.2. Soft X-ray observations
Figure 1 (right) shows the XMM–Newton/EPIC pn image (0.2–10 keV) of the IGR J16426+6536 sky region obtained from observation ID 0670390401 (see Table 2). The image is overlaid with the ISGRI error circle. Thanks to this observation, it is now possible to investigate the entire ISGRI error circle in the X-ray band in order to identify the most likely X-ray counterpart. Within it, the X-ray source n.1 corresponds to the AGN previously proposed in the literature as a counterpart. Notably, an additional X-ray source (n.2) is also detected, which has never before been considered as a potential counterpart.
Figure 1 (left) displays the Swift/XRT image (0.3–10 keV) of the same sky region, obtained by summing the two observations (obsID 00041799001 and 00041799002; see Table 3). Within the ISGRI error circle, the Seyfert AGN is detected as expected and consistent with its persistent X-ray nature. In contrast, source n.2 is not detected by Swift/XRT. We calculated a 3σ upper limit to the XRT count rate of source n.2 at a level of 5.6 × 10⁻³ counts s−1, summing together these two Swift/XRT observations (0.3–10 keV) for a vignetting-corrected exposure time of 4.1 ks. In Table 4 we summarize all results on Swift/XRT count rates and upper limits calculated using SOSTA in XIMAGE, in the energy range 0.3–10 keV.
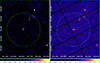 |
Fig. 1. XMM–Newton EPIC pn (right) and Swift/XRT (left) image of the IGR J16426+6536 sky region with the ISGRI error circle superimposed (90% confidence). Two X-ray sources (n.1 and n.2) are detected inside of it in the XMM–Newton image. Conversely, only X-ray source n.1 is detected in the Swift/XRT image, where the small dashed circle marks the position of the undetected X-ray source n.2. |
Swift/XRT/PC net count rates (0.3–10 keV) and/or 3σ upper limits to the count rates.
We note that the X-ray source n.2 is listed in the XMM–Newton Serendipitous Source Catalog version 4XMM-DR14 (Webb et al. 2020) under the designation 4XMM J164246.9+653553. Its X-ray coordinates are RA = 16h 42m 46.92s, Dec = +65° 35′ 53.87″ (J2000). We used the 63% confidence level positional uncertainty provided in the catalog to compute a 90% confidence error radius, which results in a value of 2 2 (including both statistical and systematic uncertainties).
The EPIC observation 0670390401 is severely affected by background flares (Fig. A.1). Therefore, we selected only the last ∼5 ks of the exposure time for any subsequent spectral and timing analysis. We extracted the source light curve of source n.2 in different energy ranges, finding no strong evidence of hardness variability along the limited clean exposure time. The EPIC spectra (net exposure time of 3.8 ks and 4.4 ks, respectively for the pn and each of the MOS cameras) are well fit by an absorbed power law model (C-stat = 200.38, 219 d.o.f; Fig. A.2), resulting into a photon index of  , an absorbing column density NH < 0.12 × 1022 cm−2, and a flux corrected for the absorption UF = 9.6 (
 ) ×10−14 erg cm−2 s−1 (0.5–10 keV; Table 5).
Spectroscopy of the XMM–Newton and Swift/XRT observations.
3.1.3. Infrared and optical observations
The arcsecond-sized positional accuracy of our proposed best-candidate X-ray counterpart allowed us to perform a reliable search for counterparts at lower energies by using all the available catalogs in the HEASARC database. No archival infrared source was located inside of it, and the nominal 2MASS limiting magnitude in the Ks band is less than 15.5 (Skrutskie et al. 2006). Conversely, only one optical GAIA source (listed in the catalog DR3 with ID 1635228086927497856) was found at a distance of 0.18″ from the X-ray positional centroid. Its magnitudes are G = 19.9, GBP = 19.9, and GRP = 19.5. We note that the GAIA mean G passband covers a wavelength range from the near ultraviolet (roughly 330 nm) to the near infrared (roughly 1050 nm), while the other two passbands, GBP and GRP, cover smaller wavelength ranges, from approximately 330 to 680 nm and 630 to 1050 nm, respectively. The GAIA distance estimate, as obtained with the photogeometric method (which uses the parallax as well as the color and the apparent magnitude of the star) is  kpc (Bailer-Jones et al. 2021). We note that this GAIA counterpart is also listed in the USNO-B1 catalog (Monet et al. 2003) with magnitudes I = 19.11, R2 = 19.77, and B2 = 19.76.
3.2. IGR J09446−2636
3.2.1. Hard X-ray observations
Our investigation with the bursticity method of the 15 years of IBIS/ISGRI archive data revealed that IGR J09446−2636 has been detected in outburst only once. The source is best detected in the softer band 17–30 keV (∼5σ, effective exposure of ∼7 ks) during the temporal period from 6 May 2005 20:10 UTC to 7 May 2005 11:31 UTC, in revolution 313. The measured average X-ray flux is 6.2 ± 1.3 mCrab (17–30 keV). We checked that the source was not detected when it was in the satellite FoV during the previous revolution, 312, from 3 May 2005 19:15 UTC to 6 May 2005 09:15 UTC. The derived 3σ flux upper limit is 3.6 mCrab (17–30 keV, effective exposure of 10 ks). Similarly, the source was not detected in the period subsequent to the outburst detection, from 7 May 2005 12:00 to 9 May 2005 09:10, and we derived a 3σ flux upper limit of 3.4 mCrab (17–30 keV, effective exposure of 11 ks). This allowed us to firmly constrain the outburst duration to ∼0.6 days.
The average IBIS/ISGRI spectrum of the source during the outburst is best fit with a power law model ( , 2 d.o.f.) with a soft photon index of
  . The average 17–30 keV (20–40 keV) flux is 3.8 × 10⁻¹¹ erg cm−2 s−1 (2.6 × 10⁻¹¹ erg cm−2 s−1). A good fit is also achieved with a blackbody model (
 , 2 d.o.f.) with temperature kT = 3.5
 keV and, alternatively, by a thermal bremsstrahlung model (
 , 2 d.o.f.) with temperature kT = 7
 keV.
keV.
3.2.2. Soft X-ray observations
Figure 2 shows the XMM–Newton/EPIC pn image of the IGR J09446−2636 sky region as obtained from obsid 0761112901 in Table 2. The image is overlaid with the ISGRI error circles. Thanks to this X-ray observation, we could investigate it in the X-ray band and search for the best X-ray counterpart candidate. The X-ray source n.1 is the Seyfert AGN previously proposed in the literature as a counterpart. We note that such an X-ray source has also been detected with Swift/XRT during all three available observations (see Table 3). This is expected given the X-ray persistent nature of Seyfert AGNs. Notably, there is an additional detected source in the XMM–Newton image (i.e., n.2) that to date has never been considered as a potential counterpart.
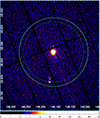 |
Fig. 2. XMM–Newton EPIC pn image (0.2–10 keV) of the IGR J09446−2636 sky region with the ISGRI error circle at a 90% confidence (dashed) and at a 95% confidence superimposed. Two X-ray sources (n.1 and n.2) are detected inside of it. |
This XMM–Newton observation is severely affected by high background flares, compelling us to select only the time interval with the lowest background level, lasting about 3 ks (enclosed by the two vertical dashed lines in Fig. A.3). The EPIC pn, MOS 1, and MOS 2 spectra of source n.2 are soft; almost all counts are concentrated below 2 keV. In fact, a fit with an absorbed power law model results in a photon index, Γ, of nine. Therefore we adopted an emission model from hot plasma (apec in XSPEC), assuming solar abundances. If we take into account the fact that the Galactic absorption toward the source is NH = 6.5 × 1020 cm−2, we can fit the EPIC spectra, fixing the absorption to this value (see Fig. A.4). We obtained the following parameters: kT = 0.37 keV and a flux corrected for the absorption of UF = 8.6
 × 10−14 erg cm−2 s−1 (0.5–10 keV; Table 5).
The spectroscopy of the Swift/XRT spectrum extracted from the observation with the longest exposure (ObsID 00041797002) results in source parameters fully consistent with the EPIC results. We report them in Table 5.
The X-ray source n.2 has not been detected in the Swift/XRT summed image of observations 00047885001 and 00041797001 (results in Table 4). We inferred a 3σ upper limit on the XRT/PC rate of 1.27 × 10⁻² counts s−1 (0.3–10 keV), which translates into an upper limit to the flux corrected for the absorption UF = 3.32 × 10⁻¹³ erg cm−2 s−1 (0.5–10 keV), assuming the same spectral parameters observed before (i.e., NH = 6.5 × 1020 cm−2) and a hot plasma temperature of 0.39 keV (apec in WebPIMMS). We note that this flux does not provide any constraint with respect to the source spectra derived from the longer exposure observations reported here.
The X-ray source n.2 is reported in the XMM–Newton serendipitous source catalog (version XMM-DR14) as 4XMM J094439.8-263919. Its X-ray coordinates are RA = 09h 44m 39s.86, Dec. = −26° 39′ 19 01 (J2000). We used the 63% confidence level positional uncertainty provided in the catalog to compute a 90% confidence error radius, which resulted in a value of 4
 1 (including both statistical and systematic uncertainties).
3.2.3. Infrared and optical observations
We used the arcsecond-sized positional accuracy of our proposed best-candidate X-ray counterpart of IGR J09446−2636 to perform a search for counterparts at lower energies by using all the available catalogs in the HEASARC database. One archival 2MASS near-infrared source is located inside of it, and its magnitudes are J = 11.96, H = 11.34, and K = 11.12, respectively. If we use the reddening-free near-infrared diagnostic Q of Negueruela & Schurch (2007), we find a Q value of 0.24, which is typical of late-type stars (K or M). This infrared counterpart has also been detected by GAIA (catalog DR3, ID 5658291556154316544). Two distance estimates are available that were obtained with two different methods: geometric (based only on the parallax) and photogeometric (which also uses the color and the apparent magnitude of the star). Both methods provide the same distance value. Hence, we assumed a distance of 108.94 ± 0.25 pc (Bailer-Jones et al. 2021). In addition, we note that the GAIA counterpart is also listed in the USNO-B1 catalog with magnitudes I = 13.03, R1 = 14.76, and B1 = 16.87.
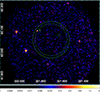 |
Fig. 3. Swift/XRT image (0.2–10 keV) of the IGR J21268+6203 sky region with the ISGRI error circle at 90% (dashed) and 95% confidence superimposed. Only one X-ray counterpart (n.1) is detected inside of it. The smallest dashed circle marks the position of the radio/infrared counterpart previously proposed in the literature, which is undetected by Swift/XRT. |
3.3. IGR J21268+6203
3.3.1. Hard X-ray observations
IGR J21268+6203 has been detected in outburst only once, as revealed by our investigation with the bursticity method of the 15 years of IBIS/ISGRI archive data. The source was detected in the energy band 20–100 keV (∼6σ, effective exposure of ∼33 ks) during revolution 511 from 19 December 2006 21:07 UTC to 22 December 2006 06:28 UTC. A similar significant detection has also been obtained in other energy bands (e.g., ∼5σ in 18–60 keV band). In order to firmly constrain the duration of the outburst activity, which is ∼3 days, we checked that the source was not significantly detected by ISGRI when it was in the satellite FoV during the previous and the subsequent revolution (510 and 512, respectively). The IBIS/ISGRI spectrum during the outburst was fit with a power law model ( , 6 d.o.f.) with a photon index of
  . The average 18–60 keV flux is 2.9 × 10⁻¹¹ erg cm−2 s−1.
3.3.2. Soft X-ray observations
Figure 3 shows the Swift/XRT image (0.2–10 keV) of the IGR J21268+6203 sky region as obtained from the sum of all six available observations (to increase the statistics) listed in Table 4. This figure allowed us to investigate the entire ISGRI error circle in the X-ray band and search for the best X-ray counterpart candidate. We note that the radio/infrared source candidate AGN previously proposed as a counterpart of IGR J21268+6203 is not detected in X–rays. This casts doubts on its associations with the INTEGRAL transient. Conversely, only one X-ray source (n.2) is detected, which we consider as the best X-ray counterpart candidate. We obtained the best-determined XRT position at RA (J2000) =  Dec (J2000) =
  with a 90% confidence error radius of 4
 3 by using the UK Swift Science Data Centre tools1.
We then extracted the Swift/XRT spectrum from the observation with the longest exposure time (ObsID 00045405006), where the X-ray source n.2 is detected with a count rate of (4.8 ± 1.4) × 10−3 count s−1 (0.3–10 keV). Almost all of its net counts are below 2 keV. In fact, if fit with an absorbed power law model, a photon index of ∼9 is found. Therefore, a hot plasma model (APEC in XSPEC) is assumed in the spectral fitting. Moreover, since the X-ray source is associated with a nearby star (details provided in the next section) with an estimated absorbing column density of NH = 6 × 1020 cm−2 (according to the tool 3D-NH2), we fixed the NH to this value. The results are reported in Table 5 and shown in Fig. A.5.
3.3.3. Infrared and optical observations
We searched for lower energy counterparts of IGR J21268+6203 by using all the available catalogs in the HEASARC database. Within the arcsecond-sized error circle of the best X-ray counterpart candidate, only one bright 2MASS infrared source was found (21271790+6206035). Its magnitudes are J = 4.96, H = 4.48, and K = 4.32. By applying the reddening-free near-infrared diagnostic parameter Q introduced by Negueruela & Schurch (2007), we obtained a value of Q = 0.2, which is typical of late-type K-M stars. Indeed, the infrared counterpart is identified in the SAO optical catalog (Whipple 1966) as a K0-type star with a visual magnitude of V = 7.6. Furthermore, it is listed in the USNO-B1 catalog with magnitudes I = 5.86, R1 = 6.52, and B1 = 8.64. The GAIA DR3 catalog provides two distance estimates derived from independent methods for this object (Gaia ID 2192883518206014848). Both yield a consistent distance value, so we assumed a distance of 272.2 ± 1.3 pc (Bailer-Jones et al. 2021).
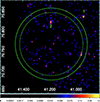 |
Fig. 4. Swift/XRT image (0.2–10 keV, obsid 00033613001 in Table 3) of the IGR J02447+7046 sky region with its IBIS/IGRI error circle at a 90% confidence (4 |


3.4. IGR J02447+7046
3.4.1. Hard X-ray observations
From our analysis of the 15 years of IBIS/ISGRI archive data using the bursticity method, we found that IGR J02447+7046 was detected in outburst only once. The source is best detected in the energy band 18–60 keV at a 5.2σ level. A slightly less significant detection was also achieved in the band 20–40 keV. The measured average X-ray flux is 29.6 ± 5.9 mCrab (18–60 keV). The onset of the hard X-ray activity is on 12 November 2003 16:20 UTC (rev 132). Unfortunately, the IBIS/ISGRI temporal coverage of the outburst is limited, as the source moved out of the FoV after 17 November 2003. When it reentered the FoV about one months later, on 12 December 2003 (rev 142), it was no longer active, as no significant detection was achieved in the 18–60 keV band. Therefore the duration of the outburst can be constrained in the range of 5–30 days, contrary to a previous report in the literature that estimated it as only ∼3 days (Bird et al. 2016). We extracted the average IBIS/ISGRI spectrum of the source during the outburst, which was fit by using a power law model ( , 3 d.o.f.) with a photon index of Γ = 2.4 ± 2.0. The average 18–60 keV flux is ∼1.0 × 10⁻¹⁰ erg cm−2 s−1.
3.4.2. Soft X-ray observations
Table 3 lists five Swift/XRT observations of IGR J02447+7046 that can be used to search for its best X-ray counterpart candidate. Figure 4 shows the Swift/XRT image of the source sky region by using the observation with the longest exposure time (obsid 00033613001 in Table 3). The X-ray source n.1 is the Seyfert AGN previously proposed in the literature as a counterpart of IGR J02447+7046. We note that this X-ray source has also been detected by Swift/XRT in all the remaining analyzed observations (obsid 00032222005 and sum of 32222002+3+4), as expected given its persistent X-ray nature. Strikingly, the AGN is located outside the ISGRI large error circle at 95% confidence (5 45 radius). Conversely, there is only one detected X-ray source inside of it (n.2), and this source has never been considered as a potential counterpart to date. In Figure 4, we note that the 95% INTEGRAL error circle is not entirely covered by the FoV of the Swift/XRT observation. However, only a very small rim (whose area is ∼3% of the total error circle area) remains outside the FoV. This uncovered portion is therefore very negligible, and it has no practical impact on counterpart identification. The 97% of the total error circle area is imaged by Swift/XRT, and this ensures that the search for the correct X-ray counterpart is not significantly affected. The identification of the proposed counterpart remains robust.
We performed the spectroscopy of source n.2 from ObsID 33613001 (performed in 2015) and from ObsID 32222005 (in 2016). At first we let the NH parameter free during the fit. Then we fixed it to the column density toward the likely optical counterpart (details are shown in the next section) resulting from the online tool 3D-NH3, which returned NH = (0.6 ± 0.3)×1022 cm−2. The results obtained with both fits are reported in Table 5.
We note that three Swift/XRT observations were performed in February 2012 in a short time interval of a few days, and they have been summed together (obsid 32222002+3+4) to increase the exposure time and the statistics (vignetting corrected exposure of 1982 seconds; see Table 4). Source n.2 was not detected, and we estimated a 3σ upper limit on the net count rate of 9.38 × 10⁻³ count s−1 (0.3–10 keV; see Table 4). Assuming a power law model with Γ = 1 and NH < 0.6 × 1022 cm−2 (see Table 5 for source spectra taken during the other XRT observations), this count rate translates into an unabsorbed flux of UF = 8.5 × 10⁻¹³ erg cm−2 s−1 (0.5–10 keV). We obtained the best determined Swift/XRT position of X-ray source n.2 at RA(J2000) =  Dec(J2000) =
  with a 90% confidence error radius of 4
 8 by using the UK Swift Science Data Centre tools.
3.4.3. Infrared, optical, and radio observations
We used the arcsecond-sized positional accuracy of the best candidate X-ray counterpart to search for counterparts at lower energies by using all the available catalogs in the HEASARC database. Only one 2MASS infrared source is located inside of it, with magnitudes J = 14.40, H = 13.98, and K = 13.74. If we use the reddening-free near-infrared diagnostic Q of Negueruela & Schurch (2007), then we find a Q value of 0.02, which is typical of early-type stars (O or B). This infrared counterpart has also been detected in the optical band as listed in the catalogs GAIA DR3 (545121204876403200) and USNO-B1. The USNO optical magnitudes are R1 = 15.90 and B1 = 18.02, respectively. Two equal distance estimates are available as obtained by GAIA with two different methods (geometric and photogeometric), and hence we assumed a distance of 2.2 kpc (Bailer-Jones et al. 2021).
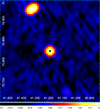 |
Fig. 5. NVSS radio map at 20 cm (as taken from the NVSS team web page http://www.cv.nrao.edu/nvss/) of IGR J02447+7046 sky region. The small black circle marks the position of the Swift/XRT error circle of the best candidate X-ray counterpart of IGR J02447+7046 (source n.2 in Fig. 4). |
Notably, the radio source NVSS J024443+704946 is located inside the Swift/XRT error circle, and its position is fully consistent with the position of the pinpointed optical/infrared counterpart. It is characterized by a 20 cm radio flux of 205 mJy. It has also been detected at a longer radio wavelength with flux values equal to 474 mJy (92 cm, Westerbork Synthesis Radio Telescope) and 707 mJy (200 cm, Giant Metrewave Radio Telescope). Figure 5 shows the Swift/XRT error circle of source n.2 superimposed on the NVSS 20 cm radio map of the sky region. The spatial match with the bright radio source NVSS J024443+704946 is evident. We considered the possibility that such an association could be spurious, and therefore we calculated the probability of finding a NVSS radio source inside the Swift/XRT error circle by chance. The probability that the nearest unrelated NVSS source lies within an angular distance, r, of any position is P = 1 − e−πρr2 (where r is the distance between the XRT centroid and the associated NVSS source, and ρ is the spatial density of NVSS sources). Given that the NVSS catalog contains ∼50 sources per square degree (Condon et al. 1998), we estimated a chance of coincidence of 2.6 × 10⁻⁴ (i.e., a probability of 0.026%). Such a significantly low probability supports a real physical association.
4. Discussion
We discuss the overall results regarding the newly proposed X-ray counterparts of the four INTEGRAL sources. A detailed description of each case is provided in the following sub-sections.
4.1. IGR J16426+6536
IGR J16426+6536 is a hard X-ray transient, and by investigating the 15-year IBIS/ISGRI data archive, we found that it was detected in outburst only once (June 2004). The outburst duration was constrained to 1–150 days, as only the first day of the rising X-ray activity was covered by INTEGRAL before the source moved out of its FoV. The measured average 18–60 keV flux (luminosity at 3.3 kpc) is ∼5.5 × 10⁻¹¹ erg cm−2 s−1 (∼7 × 1034 erg s−1), though the source likely became brighter during the unobserved phase. Unfortunately, no all-sky soft or hard X-ray monitors (e.g., MAXI and Swift/BAT, respectively) were available at the time to track a potential brighter phase. Despite extensive INTEGRAL coverage (effective exposure ∼2.7 Ms), no persistent hard X-ray emission was detected. We derived a 20–40 keV 3σ upper limit flux (luminosity) of 0.3 mCrab or 2.3 × 10⁻¹² erg cm−2 s−1 (3 × 1033 erg s−1).
We used archival XMM–Newton and Swift/XRT soft X-ray data to perform a new analysis of the entire INTEGRAL large error circle. Two X-ray sources were detected: source n.1 is X-ray persistent and a confirmed Seyfert AGN; source n.2 is a weak and unidentified X-ray emitter. Previously, the AGN had been proposed as a counterpart of IGR J16426+6536 based on circumstantial evidence. Here we note that this interpretation conflicts with its transient hard X-ray nature as well as with the INTEGRAL upper limit on its persistent X-ray emission, as all firmly identified Seyfert AGNs detected by INTEGRAL are persistent X-ray sources. Furthermore, the AGN redshift value (z = 0.323) is significantly higher than typical values of INTEGRAL Seyfert AGNs (i.e., average z = 0.033, maximum z = 0.1; Butler et al. 2009). Clearly IGR J16426+6536 would be an outlier, and this would be very difficult to justify. In addition, IGR J16426+6536 is not listed in the Swift/BAT 157-month survey hard X-ray catalog (Lien et al. 2025), which reports almost 1000 firmly identified Seyfert AGNs, further supporting the evidence that it is not such an object. It is likely too distant to be detected at hard X-ray by INTEGRAL or Swift/BAT. In fact, a simple flux–luminosity argument indicates that an AGN at the redshift of XMMSL1 J164303.7+653253 (z = 0.323) would be far too faint to be detected in hard X-rays by INTEGRAL or Swift/BAT. At this redshift, the expected hard X-ray flux, even for an X-ray luminosity of ∼1044 erg s−1 (20–40 keV), would be of the order of ∼3 × 10⁻¹³ erg cm−2 s−1, well below the sensitivity of both INTEGRAL/IBIS and Swift/BAT. At their typical survey depths, only X-ray sources with Lx > 4 × 1045 erg s−1 and Lx > 2 × 1045 erg s−1 could be detected at z = 0.323 by INTEGRAL and Swift/BAT, respectively. By more than an order of magnitude, these values exceed the hard X-ray luminosities typically measured for the bulk of the local Seyfert population detected in INTEGRAL and BAT surveys, whose median redshift is z ∼ 0.03 (Butler et al. 2009; Ajello et al. 2012).
One possible classification for the AGN XMMSL1 J164303.7+653253 is that of a Narrow-Line Seyfert 1 (NLS1). While a handful of NLS1s have indeed been detected as γ-ray emitters with Fermi-LAT (Abdo et al. 2009), these constitute a rare subgroup, generally associated with radio-loud systems hosting relativistic jets (Yuan et al. 2008). The vast majority of NLS1s, including those identified in hard X-ray surveys, show no evidence of γ-ray emission above 100 MeV (Ajello et al. 2012). Therefore, while the NLS1 classification would in principle make a γ-ray emitting scenario physically possible, the absence of any γ-ray detection for XMMSL1 J164303.7+653253 is not surprising and does not necessarily support the association with IGR J16426+6536.
Taken at face value, all of these findings suggest that the Seyfert AGN is not the true counterpart of IGR J16426+6536. Conversely, the X-ray characteristics of source n.2 are more compatible with those of IGR J16426+6536. Hence we propose it as the best candidate X-ray counterpart. Within its arcsecond-sized error circle, we pinpointed a single optical object at ∼3.3 kpc, placing it within the boundaries of our Galaxy. Although the relatively high Galactic latitude of IGR J16426+6536 (b ∼ 38°) could initially suggest an extragalactic origin, such a position is fully consistent with a Galactic object located above the Galactic plane at a vertical height of z ∼ 2 kpc.
Based on our results, we propose that IGR J16426+6536 is a Galactic X-ray binary. Its elevated vertical height above the Galactic plane is unusual for disk sources, which typically have z < 1 kpc, but remains compatible with low-mass X-ray binaries (LMXBs) or very faint X-ray transients (VFXTs) that have received strong natal kicks or are formed in the Galactic halo, for example, the LMXB XTE J1118+480 with z > 1.5 kpc (Jonker & Nelemans 2004; Repetto et al. 2012). In this context, the magnitude values of the optical counterpart as well as the near-infrared magnitude upper limit support a faint low-mass donor star for IGR J16426+6536 and hence favor a classification as an LMXB or a VFXT in the halo. The transient X-ray nature of IGR J16426+6536, its outburst lasting 1–150 days with a lower limit X-ray luminosity of ∼7 × 1034 erg s−1, and its quiescent X-ray state of 1.2 × 1032 erg −1 are all consistent with the typical behavior of VFXTs Wijnands et al. (2006), Degenaar & Wijnands (2009)), similar to other such systems detected by INTEGRAL (Sguera & Sidoli 2024). Alternatively, the source could be a classical LMXB if we consider the eventuality of a potentially unobserved brighter X-ray phase.
4.2. IGR J09446−2636
By investigating the 15-year IBIS/ISGRI archive, we found that IGR J09446−2636 was detected by INTEGRAL in outburst only once (May 2005). The outburst duration was ∼0.6 days, revealing a short hard X-ray transient nature. The source was best detected in the 17–30 keV band with a soft power law spectrum (Γ ∼ 4.8) indicative of thermal emission. A good fit was also obtained with a blackbody or bremsstrahlung model. The average 17–30 keV flux (luminosity at 109 pc) is ∼3.8 × 10⁻¹¹ erg cm−2 s−1 (∼5.5 × 1031 erg s−1). Despite significant INTEGRAL coverage (effective exposure ∼560 ks), no persistent hard X-ray emission was detected. We derived a 20–40 keV 3σ upper limit flux (luminosity) of 0.9 mCrab or 6.9 × 10⁻¹² erg cm−2 s−1 (9.3 × 1030 erg s−1).
Using archival XMM–Newton and Swift X-ray observations, we investigated the entire INTEGRAL error circle in order to search for the soft X-ray counterpart. Two X-ray sources were detected inside of it: source n.1 is X-ray persistent and a confirmed Seyfert AGN; source n.2 is a weak X-ray emitter and unidentified. Although the AGN was previously proposed in the literature as a counterpart, we note here that its persistent X-ray nature is inconsistent with the transient X-ray behavior of IGR J09446−2636 as well as its INTEGRAL upper limit on the persistent X-ray emission. Furthermore, the ISGRI spectrum of the source is soft and thermal, which is inconsistent with an AGN nature. We note that the AGN redshift (z = 0.14) exceeds the typical values of Seyfert AGNs firmly detected by INTEGRAL (average z = 0.033). This would make IGR J09446−2636 an outlinear, and it would be very difficult to explain it. In addition, IGR J09446-2636 is not listed in the Swift/BAT 157-month survey hard X-ray catalog, which reports almost 1000 firmly identified Seyfert AGN, further supporting the evidence that it is not an AGN. Conversely, the X-ray characteristics of source n.2 are more compatible with those of IGR J09446-2636. In fact, its X-ray spectrum is soft and thermal, as measured by XMM–Newton, and this fully agrees with the soft spectrum measured above 17 keV by ISGRI. Hence, we propose the X-ray source n.2 as the true X-ray counterpart of IGR J09446-2636.
Within its arcsecond-sized error circle, we identified a single optical/infrared object at ∼109 pc, placing it well within the boundaries of our Galaxy. Although the relatively high Galactic latitude of IGR J09446−2636 (b ∼ 20°) could suggest an extragalactic origin, this position is fully consistent with a very nearby Galactic object located above the Galactic plane with vertical height z ∼ 38 pc. Its photometric properties are consistent with a late-type star (F to M spectral type).
The ratio of X-ray to optical flux can be used to identify its nature (Maccacaro et al. 1988). The optical counterpart has a V = 15.8 mag (Zacharias et al. 2013), and the observed flux in the 0.3–3.5 keV band is 8 × 10⁻¹⁴ erg cm−2 s−1, leading to log , which is consistent with coronal emission from M- or K-type stars.
In the light of our reported results on IGR J09446−2636, we propose its identification as a flaring star, a class of active late-type objects known to produce short and energetic outbursts both in the soft and hard X-ray band (Güdel 2004; Maggio 2008). Such stars are commonly found at intermediate Galactic latitudes due to their proximity and to the vertical scale height of the local stellar population (Fleming et al. 1995). The X-ray emission arises from magnetic energy release in the stellar coronae of magnetically active stars, such as solar-type stars, K-M dwarfs, or pre-main-sequence stars. Stellar X-ray flares typically last from hours to days, with peak X-ray luminosities in the range of 1029–1034 erg s−1 (Zhao et al. 2024). In particular, hard X-ray emission from flaring stars is mainly thermal in origin, being best interpreted by single or multitemperature models of an optically thin plasma. The soft and thermal X-ray spectrum measured with both XMM–Newton and ISGRI is in agreement with this interpretation. Moreover, the flare duration and its hard X-ray luminosity match expectations for stellar flares detected by INTEGRAL in the hard X-ray band (Sguera et al. 2016b).
4.3. IGR J21268+6203
From our analysis, we find that IGR J21268+6203 is a hard X-ray transient detected in outburst only once throughout the 15-year IBIS/ISGRI archival dataset. The outburst duration was constrained to ∼3 days, with an average 18–60 keV flux (luminosity) of ∼2.9 × 10⁻¹¹ erg cm−2 s−1 (∼2.5 × 1032 erg s−1). Despite the extensive INTEGRAL coverage (effective exposure of ∼3.3 Ms), no persistent hard X-ray emission was detected. We derived a 3σ upper limit on the 20–40 keV flux of 0.3 mCrab, or 2.3 × 10⁻¹² erg cm−2 s−1.
To identify the most likely soft X-ray counterpart, we analyzed Swift/XRT archival observations fully covering the INTEGRAL error circle. A single X-ray source was detected within it, which we propose as the best candidate X-ray counterpart. Within its arcsecond-sized error circle, we identified a single bright optical/infrared source classified as a K0-type star located at a distance of ∼272 pc. Its Galactic latitude of ∼8° is fully consistent with a nearby Galactic object located slightly above the Galactic plane (z ∼ 38 pc).
In the literature, IGR J21268+6203 had been proposed as a candidate AGN, primarily based on its position slightly off the Galactic plane as well as on the presence of an arbitrarily chosen radio candidate counterpart within the INTEGRAL large error circle. However, we note that this interpretation is inconsistent with our reported properties on IGR J21268+6203. Specifically, the short hard X-ray outburst duration and the lack of persistent hard X-ray emission are incompatible with the typical behavior of non-blazar-like AGNs, which are known to be persistent hard X-ray emitters when detected by INTEGRAL. Moreover the candidate radio counterpart, previously suggested as a candidate AGN, was not detected in X-rays despite being observed for the first time in this band, casting serious doubt on its association with IGR J21268+6203. In this context, we note that only a small fraction of AGNs are intrinsically X-ray weak. Systematic studies from large surveys show that only ∼5% are underluminous in the X-rays by a factor of more than six compared to the X-ray level expected from their ultraviolet emission (Pu et al. 2020). Such extreme X-ray faintness is therefore rare among the class of AGNs. Thus, the absence of an X-ray detection for the previously proposed AGN counterpart of IGR J21268+6203 is statistically unlikely for a typical AGN and favors a Galactic origin for the true counterpart.
Given its proximity and modest height above the plane, IGR J21268+6203 is plausibly a nearby flaring star. Indeed the optical/infrared counterpart is a late-type K0 star. The soft and thermal quiescent X-ray spectrum measured with Swift/XRT and the corresponding low X-ray luminosity of ∼4.8 × 1029 erg s−1 both fully agree with the X-ray characteristics of flaring late-type stars. Also, the very low ratio of X-ray to optical flux (Maccacaro et al. 1988) confirms that the X-ray emission comes from the K-type star (log , using V = 7.6 mag and a flux of 5 × 10⁻¹⁴ erg cm−2 s−1 (0.3–3.5 keV) measured with Swift/XRT). As for the INTEGRAL detection in outburst, both the duration and average X-ray luminosity are consistent with a flaring star nature (Zhao et al. 2024) and match expectations for stellar flares detected by INTEGRAL in the hard X-ray band (Sguera et al. 2016a).
4.4. IGR J02447+7046
IGR J02447+7046 is a hard X-ray transient detected by INTEGRAL in outburst only once, in November 2003, over the 15 years of data in the IBIS/ISGRI archive. The outburst duration was constrained to the range 5–30 days, as only the early phase of the activity was covered by INTEGRAL before the source moved out of its FoV. The average 18–60 keV flux is ∼1.0 × 10⁻¹⁰ erg cm−2 s−1, corresponding to a luminosity of ∼5.8 × 1034 erg s−1 at a distance of 2.2 kpc, although the source likely reached a higher flux during the unobserved interval. Unfortunately, no soft or hard X-ray all-sky monitors (such as MAXI or Swift/BAT) were operational at the time to constrain a possible brighter phase. Despite the extensive INTEGRAL monitoring (effective exposure ∼1.1 Ms), no persistent hard X-ray emission was detected. We derived a 3σ upper limit in the 20–40 keV band of 0.4 mCrab or 3 × 10⁻¹² erg cm−2 s−1 (1.7 × 1033 erg s−1 at 2.2 kpc).
To search for the most likely X-ray counterpart, we analyzed Swift/XRT observations covering the entire INTEGRAL error circle. Only one Swift/XRT source was detected within it, and hence we propose it as the candidate soft X-ray counterpart. Within its arcsecond-sized error circle, we identified a single optical/infrared counterpart located at ∼2.2 kpc. Its photometric properties are consistent with an early-type star. Remarkably, this low-energy counterpart is also detected as a very bright radio source at 20, 92, and 200 cm.
For completeness, we note that a Seyfert AGN had previously been proposed in the literature as the counterpart of IGR J02447+7046. The AGN is detected in all Swift/RT observations; however, its position strikingly lies outside the INTEGRAL error circle at 95% confidence. Moreover, its persistent X-ray nature is at odds with the transient hard X-ray behavior as well as the stringent INTEGRAL upper limit on the persistent emission of IGR J02447+7046. In addition, its redshift (z = 0.306) is significantly higher than typical values for Seyfert AGNs firmly detected by INTEGRAL (average z ∼ 0.033). It would be difficult to justify IGR J02447+7046 as an outlier. All of these findings suggest that the Seyfert AGN is too distant to be detected at INTEGRAL hard X-ray energies (see details in section 4.1 for the similar case of IGR J16426+6536). Indeed, IGR J02447+7046 is not listed in the Swift/BAT 157-month survey hard X-ray catalog, which includes nearly 1,000 Seyfert AGNs. Taken at face value, our results rule out the AGN scenario for IGR J02447+7046.
Based on our collected results, we propose that IGR J02447+7046 is a Galactic massive binary system with a neutron star. Considering that the source distance is ∼2.2 kpc and it is located at a Galactic latitude of ∼10°, this places it about 382 pc above the Galactic plane. Such a vertical height remains compatible with a Galactic origin, especially for high-mass X-ray binaries (HMXBs) that may have been displaced from the plane by supernova kicks. The transient hard X-ray emission of IGR J02447+7046, lasting between 5 and 30 days and having a lower limit luminosity in outburst of ∼5.8 × 1034 erg s−1, is in agreement with the typical outburst characteristics of Be HMXBs (Reig 2011), as opposed to the much shorter activity typically observed in Supergiant Fast X-ray Transients (Sguera et al. 2006). We pinpointed an early-type optical/infrared counterpart that supports this classification. Although there is no evidence for a soft X-ray variability during the very few snapshots taken by Swift/XRT at the source location, its hard spectrum in the 0.3–10 keV energy range is compatible with a massive X-ray binary.
Notably, the association of the proposed soft X-ray and optical counterpart with a very bright radio source is intriguing and leads us to propose a specific type of massive binary, i.e., a γ-ray binary composed of a young pulsar orbiting a Be star. By adopting the three available radio flux measurements at 20, 92, and 200 cm, we calculated a power law spectral slope of α = −0.56 (where the flux density is Sν ∝ να). This value is typical of optically thin synchrotron radio emission and is consistent with a non-thermal origin, such as a pulsar wind shock in a γ-ray binary. An alternative explanation involving radio emission from a relativistic jet is unlikely since the radio spectrum in this scenario is usually flatter (with α ∼ 0.0). Moreover, if we extrapolate the power law radio spectrum (α = −0.56) to 6 GHz, we obtain a flux density of ≈80 mJy, translating into a radio luminosity of LR ∼ 3 × 1030 erg s−1 (at 2.2 kpc). This 6 GHz luminosity would be comparable to jet emission only in the case of black hole X-ray binaries with X-ray luminosities exceeding 1036 erg s−1 (0.5–10 keV), assuming the observed correlation for such systems in the radio/X-ray plane (van den Eijnden et al. 2021). Moreover, X-ray transient black hole binaries host low mass companions, which is at odds with the early-type optical counterpart.
On the other hand, γ-ray binaries composed by a young pulsar orbiting a Be star typically show high radio luminosities and relatively low X-ray luminosities, characteristics that are more consistent with our proposed counterpart of IGR J02447+7046. A notable example is PSR B1259-63, which hosts a 47.76 ms pulsar orbiting the Be star LS 2883 in a 3.4 yr highly eccentric orbit (e = 0.87). Located at a similar distance (2.4 kpc), this system shows variable emission across the electromagnetic spectrum, from radio to TeV energies, modulated by the orbital period. It also displays a flux density of a few tenths of milli-Jansky at frequencies of ∼6 GHz, a similar radio spectral index, a hard X-ray spectrum below 10 keV (power law photon index of 1.5–1.9), and low X-ray luminosities in the range of ∼1033–1034 erg s−1 in soft X-rays (Kaspi et al. 1995; Chernyakova et al. 2024). Since the radio emission is produced in the shock between the pulsar wind and the Be star’s outflow along the orbit, it can be highly variable depending on the specific properties of the system and on its orbital geometry. We note that no known MeV-GeV sources listed in published Fermi/LAT catalogs are positionally consistent with NVSS J024443+704946. As for the TeV band, to date the sky region of IGR J02447+7046 has never been covered by MAGIC or VERITAS observations, while the source is not visible to H.E.S.S. due to its high northern declination. Therefore, a more detailed and close comparison with known γ-ray binaries might be premature at this stage. To better understand the nature and origin of the radio emission detected from IGR J02447+7046, dedicated follow-up observations in the millimeter and radio bands are encouraged.
4.5. Additional remarks on the INTEGRAL sources
The robustness of the four INTEGRAL transient sources reported in the IBIS catalog by Bird et al. (2016) can be assessed as follows. As stated in the catalog, simulations based on randomized and inverted light curves show that for transient sources detected with the bursticity method, the mean false positive rate alarm probability per light curve above a 6σ significance lies in the range of 1% (statistical best case) to 3.5% (systematic worst case). When requiring temporal coincidence in more than one energy band (the criterion adopted in the catalog), the statistical probability falls to less than 1% even above 4.5σ. The final overall false positive rate for sources detected with the bursticity method is pessimistically assumed to be ∼1% after accounting for possible systematic effects and is further constrained by manual image and/or light curve inspection to reject ghosts and noisy intervals. In particular, the false positive probability for transient sources detected with the bursticity at a lower significance (< 6σ) and on shorter timescales is higher than the cited overall final level. Warning flags are appended to such sources in the table catalog to indicate detections subject to a higher false positive rate. We note that among the four INTEGRAL transients studied in this work, IGR J21268+6203 is the only one indicated with a warning flag in the IBIS catalog. However, we point out that its significance detection (5.9σ) is very slightly below the mentioned 6σ threshold. All the above assumptions support the conclusion that at least three of the four INTEGRAL transients are genuine astrophysical sources, with a very strong likelihood that all four are real.
To strengthen the rejection of the AGNs as candidate counterparts, we investigated their long-term behavior. For the case of IGR J16426+6536, IGR J02447+7046, and IGR J09446−2636, the associated AGN is characterized by persistent soft X-ray emission (expected for Seyfert galaxies) with no sign of X-ray flaring behavior, while the INTEGRAL detections correspond to isolated, short hard X-ray outbursts with no persistent hard X-ray emission. We note that for IGR J21268+6203, the associated radio candidate AGN is undetected in X-rays. Overall, none of the four AGNs are reported in the SwiftBAT 157-month catalog, which contains ∼1000 Seyferts (Lien et al. 2025). This behavior contrasts with that of known γ-ray flaring AGNs, including narrow-line Seyfert 1 galaxies, where high energy outbursts are always accompanied by strong multiwavelength variability and persistent X-ray detection. Moreover, γ-ray emitting NLS1s are rare, and even among them only a few display extreme high energy flares (e.g., D’Ammando et al. 2015). Consequently, the available long-term constraints coupled with the absence of multi-band flaring episodes disfavor an AGN association for the four INTEGRAL sources.
To place the two proposed X-ray counterparts of IGR J09446−2636 and IGR J21268+6203 in the broader context of stellar X-ray emitters, we compared them with the NEXXUS survey (Schmitt & Liefke 2004), which is based on ROSAT observations and provides a nearly complete census of nearby late-type stars. NEXXUS characterizes the coronal X-ray properties of these stars, making it an ideal reference sample. The distribution of log(fX/fopt) derived from NEXXUS shows that the proposed INTEGRAL counterparts of IGR J09446−2636 and IGR J21268+6203 fall well within the stellar locus (see Figure 6). This demonstrates that their X-ray to optical flux ratios are fully consistent with stellar coronal emission, reinforcing their classification.
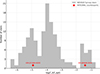 |
Fig. 6. Distribution of log(fX/fopt) for nearby late-type stars from the NEXXUS Survey sample (Schmitt & Liefke 2004) computed following Maccacaro et al. (1988). The proposed X-ray counterparts of IGR J09446−2636 and IGR J21268+6203 are shown as red stars. Both sources lie within the stellar locus. |
To further assess the robustness of our proposed X-ray counterparts, we estimated the probability of a chance coincidence for IGR J16426+6536 and IGR J09446−2636. We excluded from the calculation the remaining cases of IGR J02447+7046 and IGR J21268+6203 because inside their ISGRI error circle, there is only a single Swift/XRT counterpart since the bright X-ray AGN lies outside of it in the case of IGR J02447+7046, while the candidate radio AGN is not detected in the X-ray band in the case of IGR J21268+6203. The probability that the nearest unrelated X-ray source lies within an angular distance r is P = 1 − e−πρr2. We adopted a value of the surface density of background X-ray sources (ρ) equal to ρ = 8 deg−2 and ρ = 30 deg−2 for IGR J09446−2636 and IGR J16426+6536, respectively (Mateos et al. 2008). We used the observed source flux in the energy band 0.5–2 keV (7.1 × 10⁻¹⁴ erg cm−2 s−1) for IGR J09446−2636 and in the 2–10 keV energy range (4.7 × 10⁻¹⁴ erg cm−2 s−1) for IGR J16426+6536. We obtained chance association probabilities of ∼28% for IGR J16426+6536 ( ) and ∼19% for IGR J09446−2636 (
 ). At face value, such probabilities appear non-negligible and could suggest, if regarded on their own, a spurious association. However, when combined with the amount of independent evidence supporting the associations and with the spectral and temporal arguments that disfavor the brighter AGN as possible counterparts, our proposed X-ray counterparts are plausible.
5. Conclusions
We have carried out a comprehensive analysis of four hard X-ray sources discovered by INTEGRAL and whose X-ray characteristics were previously largely unknown. These sources had been tentatively classified as AGNs in earlier works, but such associations were based on unconfirmed evidence. In this work we propose alternative soft X-ray counterparts pointing to a Galactic nature instead.
By combining soft and hard X-ray observations, we have been able to characterize the X-ray characteristics of these four sources in greater detail and pinpoint the most likely X-ray counterpart. Through a multiwavelength approach, we identified their optical and infrared counterparts. All the collected results and the derived properties of these counterparts point to a Galactic origin for all four INTEGRAL hard X-ray sources. Specifically, we find that one is likely a VFXT or a classical LMXB (IGR J16426+6536); one is best interpreted as a massive binary with a Be companion, in particular a γ-ray binary (IGR J02447+7046); and finally two are consistent with a flaring star nature (IGR J09446−2636 and IGR J21268+6203).
Acknowledgments
We thank the referee for the prompt and constructive comments. This work is based on observations performed with XMM–NewtonSwift and INTEGRAL satellites. We made use of the High Energy Astrophysics Science Archive Research Center (HEASARC), a service of the Astrophysics Science Division at NASA/GSFC. This research has made use of data obtained from the 4XMM XMM-Newton serendipitous source catalogue compiled by the XMM-Newton Survey Science Centre consortium. This work has made use of data from the European Space Agency (ESA) mission Gaia (https://www.cosmos.esa.int/gaia), processed by the Gaia Data Processing and Analysis Consortium (DPAC, https://www.cosmos.esa.int/web/gaia/dpac/consortium). This work made use of data supplied by the UK Swift Science Data Centre at the University of Leicester (Goad et al. 2007; Evans et al. 2009). We acknowledge funding from the grant entitled “Bando Ricerca Fondamentale INAF 2023”.
References
- Abdo, A. A., Ackermann, M., Ajello, M., et al. 2009, ApJ, 707, L142 [NASA ADS] [CrossRef] [Google Scholar]
- Ajello, M., Shaw, M. S., Romani, R. W., et al. 2012, ApJ, 751, 108 [NASA ADS] [CrossRef] [Google Scholar]
- Arnaud, K. A. 1996, in Astronomical Data Analysis Software and Systems V, eds. G. H. Jacoby, & J. Barnes, ASP Conf. Ser., 101, 17 [NASA ADS] [Google Scholar]
- Bailer-Jones, C. A. L., Rybizki, J., Fouesneau, M., Demleitner, M., & Andrae, R. 2021, AJ, 161, 147 [Google Scholar]
- Bird, A. J., Malizia, A., Bazzano, A., et al. 2007, ApJS, 170, 175 [Google Scholar]
- Bird, A. J., Bazzano, A., Bassani, L., et al. 2010, ApJS, 186, 1 [NASA ADS] [CrossRef] [Google Scholar]
- Bird, A. J., Bazzano, A., Malizia, A., et al. 2016, ApJS, 223, 15 [Google Scholar]
- Burrows, D. N., Hill, J. E., Nousek, J. A., et al. 2005, Space Sci. Rev., 120, 165 [Google Scholar]
- Butler, S. C., Tomsick, J. A., Chaty, S., et al. 2009, ApJ, 698, 502 [NASA ADS] [CrossRef] [Google Scholar]
- Cash, W. 1979, ApJ, 228, 939 [Google Scholar]
- Chernyakova, M., Malyshev, D., van Soelen, B., et al. 2024, MNRAS, 528, 5231 [Google Scholar]
- Condon, J. J., Cotton, W. D., Greisen, E. W., et al. 1998, AJ, 115, 1693 [Google Scholar]
- D’Ammando, F., Orienti, M., Finke, J., et al. 2015, MNRAS, 446, 2456 [Google Scholar]
- Degenaar, N., & Wijnands, R. 2009, A&A, 495, 547 [NASA ADS] [CrossRef] [EDP Sciences] [Google Scholar]
- Evans, P. A., Beardmore, A. P., Page, K. L., et al. 2009, MNRAS, 397, 1177 [Google Scholar]
- Fleming, T. A., Schmitt, J. H. M. M., & Giampapa, M. S. 1995, ApJ, 450, 401 [NASA ADS] [CrossRef] [Google Scholar]
- Gehrels, N., Chincarini, G., Giommi, P., et al. 2004, ApJ, 611, 1005 [Google Scholar]
- Goad, M. R., Tyler, L. G., Beardmore, A. P., et al. 2007, A&A, 476, 1401 [NASA ADS] [CrossRef] [EDP Sciences] [Google Scholar]
- Güdel, M. 2004, A&A Rev., 12, 71 [Google Scholar]
- Ibarra, A., Kuulkers, E., & Saxton, R. 2008, ATel, 1397, 1 [Google Scholar]
- Jansen, F., Lumb, D., Altieri, B., et al. 2001, A&A, 365, L1 [NASA ADS] [CrossRef] [EDP Sciences] [Google Scholar]
- Jonker, P. G., & Nelemans, G. 2004, MNRAS, 354, 355 [Google Scholar]
- Kaspi, V. M., Tavani, M., Nagase, F., et al. 1995, ApJ, 453, 424 [Google Scholar]
- Krivonos, R., Revnivtsev, M., Lutovinov, A., et al. 2007, A&A, 475, 775 [NASA ADS] [CrossRef] [EDP Sciences] [Google Scholar]
- Krivonos, R. A., Tsygankov, S. S., Mereminskiy, I. A., et al. 2018, VizieR Online Data Catalog: INTEGRAL 14-year Galactic hard X-ray sources (Krivonos+, 2017), VizieR On-line Data Catalog: J/MNRAS/470/512. Originally published. In: 2017MNRAS.470.512K [Google Scholar]
- Krivonos, R. A., Sazonov, S. Y., Kuznetsova, E. A., et al. 2022, MNRAS, 510, 4796 [NASA ADS] [CrossRef] [Google Scholar]
- Lebrun, F., Leray, J. P., Lavocat, P., et al. 2003, A&A, 411, L141 [NASA ADS] [CrossRef] [EDP Sciences] [Google Scholar]
- Lien, A. Y., Krimm, H., Markwardt, C., et al. 2025, arXiv e-prints [arXiv:2506.04109] [Google Scholar]
- Maccacaro, T., Gioia, I. M., Wolter, A., Zamorani, G., & Stocke, J. T. 1988, ApJ, 326, 680 [NASA ADS] [CrossRef] [Google Scholar]
- Maggio, A. 2008, Mem. Soc. Astron. It., 79, 186 [Google Scholar]
- Maiorano, E., Landi, R., Stephen, J. B., et al. 2011, MNRAS, 416, 531 [NASA ADS] [Google Scholar]
- Masetti, N., Mason, E., Morelli, L., et al. 2008, A&A, 482, 113 [NASA ADS] [CrossRef] [EDP Sciences] [Google Scholar]
- Masetti, N., Parisi, P., Palazzi, E., et al. 2009, A&A, 495, 121 [NASA ADS] [CrossRef] [EDP Sciences] [Google Scholar]
- Masetti, N., Parisi, P., Palazzi, E., et al. 2013, A&A, 556, A120 [NASA ADS] [CrossRef] [EDP Sciences] [Google Scholar]
- Mateos, S., Warwick, R. S., Carrera, F. J., et al. 2008, A&A, 492, 51 [NASA ADS] [CrossRef] [EDP Sciences] [Google Scholar]
- Molina, M., Bassani, L., Malizia, A., et al. 2013, MNRAS, 433, 1687 [NASA ADS] [CrossRef] [Google Scholar]
- Monet, D. G., Levine, S. E., Canzian, B., et al. 2003, AJ, 125, 984 [Google Scholar]
- Negueruela, I., & Schurch, M. P. E. 2007, A&A, 461, 631 [NASA ADS] [CrossRef] [EDP Sciences] [Google Scholar]
- Panessa, F., de Rosa, A., Bassani, L., et al. 2011, MNRAS, 417, 2426 [Google Scholar]
- Parisi, P., Masetti, N., Malizia, A., et al. 2008, ATel, 1800, 1 [Google Scholar]
- Pu, X., Luo, B., Brandt, W. N., et al. 2020, ApJ, 900, 141 [Google Scholar]
- Reig, P. 2011, Ap&SS, 332, 1 [Google Scholar]
- Repetto, S., Davies, M. B., & Sigurdsson, S. 2012, MNRAS, 425, 2799 [Google Scholar]
- Saxton, R. D., Read, A. M., Esquej, P., et al. 2008, A&A, 480, 611 [NASA ADS] [CrossRef] [EDP Sciences] [Google Scholar]
- Sazonov, S., Revnivtsev, M., Krivonos, R., Churazov, E., & Sunyaev, R. 2007, A&A, 462, 57 [NASA ADS] [CrossRef] [EDP Sciences] [Google Scholar]
- Schmitt, J. H. M. M., & Liefke, C. 2004, A&A, 417, 651 [NASA ADS] [CrossRef] [EDP Sciences] [Google Scholar]
- Sguera, V., & Sidoli, L. 2024, A&A, 690, A260 [NASA ADS] [CrossRef] [EDP Sciences] [Google Scholar]
- Sguera, V., Bazzano, A., Bird, A. J., et al. 2006, ApJ, 646, 452 [NASA ADS] [CrossRef] [Google Scholar]
- Sguera, V., Bazzano, A., Fiocchi, M., et al. 2016a, ATel, 9255, 1 [Google Scholar]
- Sguera, V., Sidoli, L., Paizis, A., & Bird, A. J. 2016b, MNRAS, 463, 2885 [Google Scholar]
- Skrutskie, M. F., Cutri, R. M., Stiening, R., et al. 2006, AJ, 131, 1163 [NASA ADS] [CrossRef] [Google Scholar]
- Ubertini, P., Lebrun, F., Di Cocco, G., et al. 2003, A&A, 411, L131 [CrossRef] [EDP Sciences] [Google Scholar]
- van den Eijnden, J., Degenaar, N., Russell, T. D., et al. 2021, MNRAS, 507, 3899 [NASA ADS] [CrossRef] [Google Scholar]
- Verner, D. A., Ferland, G. J., Korista, K. T., & Yakovlev, D. G. 1996, ApJ, 465, 487 [Google Scholar]
- Webb, N. A., Coriat, M., Traulsen, I., et al. 2020, A&A, 641, A136 [NASA ADS] [CrossRef] [EDP Sciences] [Google Scholar]
- Whipple, F. L. 1966, Smithsonian Astrophysical Observatory Star Catalog [Google Scholar]
- Wijnands, R., in’t Zand, J. J. M., Rupen, M., et al. 2006, A&A, 449, 1117 [NASA ADS] [CrossRef] [EDP Sciences] [Google Scholar]
- Wilms, J., Allen, A., & McCray, R. 2000, ApJ, 542, 914 [Google Scholar]
- Winkler, C., Courvoisier, T. J. L., Di Cocco, G., et al. 2003, A&A, 411, L1 [NASA ADS] [CrossRef] [EDP Sciences] [Google Scholar]
- Yuan, W., Zhou, H. Y., Komossa, S., et al. 2008, ApJ, 685, 801 [NASA ADS] [CrossRef] [Google Scholar]
- Zacharias, N., Finch, C. T., Girard, T. M., et al. 2013, AJ, 145, 44 [Google Scholar]
- Zhao, Z. H., Hua, Z. Q., Cheng, X., Li, Z. Y., & Ding, M. D. 2024, ApJ, 961, 130 [NASA ADS] [CrossRef] [Google Scholar]
Appendix A: Additional figures
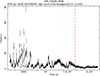 |
Fig. A.1. XMM–Newton EPIC pn background light curve (10-12 keV) IGR J16426+6536 extracted from a large source-free region of ObsID 0670390401 (bin time of 10 s). For any subsequent data analysis and extraction of products, we selected only the last ∼5 ks, right of the dashed, red vertical line. |
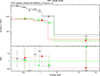 |
Fig. A.2. XMM–Newton EPIC spectra of X-ray source n.2 (ObsID 0670390401) counterpart of IGR J16426+6536. The top panel shows the data fit with an absorbed power law model, while the bottom panel the ratio of the data to the model. Open (black) circles mark the pn spectrum, solid (red) stars indicates the MOS 1 spectrum and solid (green) squares mark the MOS 2 data points. The spectra have been severely binned for graphical purposes only. |
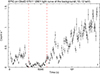 |
Fig. A.3. XMM–Newton EPIC pn background light curve (10-12 keV) of IGR J09446-2636 extracted from a large source-free region of ObsID 0761112901. For any subsequent data analysis and extraction of products, we selected the time interval with a duration of ∼3 ks within the two red, dashed vertical lines (time bin = 100 s). |
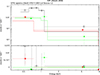 |
Fig. A.4. XMM–Newton EPIC spectra of X-ray source n.2 (ObsID 0761112901) counterpart of IGR J09446-2636. The top panel shows the data fit with an absorbed thermal plasma model, while the bottom panel the residuals. Open (black) circles mark the pn spectrum, solid (red) stars indicates the MOS 1 spectrum and solid (green) squares mark the MOS 2 data points. The spectra have been severely binned for graphical purposes only. |
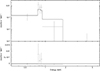 |
Fig. A.5. Swift/XRT spectrum of the newly proposed counterpart of IGR J21268+6203 from ObsID 45405006, as reported in Table 5. The residuals of the data with respect to the model are shown in the bottom panel. The spectrum has been severely binned for graphical purposes only. |
All Tables
Swift/XRT/PC net count rates (0.3–10 keV) and/or 3σ upper limits to the count rates.
All Figures
|
Fig. 1. XMM–Newton EPIC pn (right) and Swift/XRT (left) image of the IGR J16426+6536 sky region with the ISGRI error circle superimposed (90% confidence). Two X-ray sources (n.1 and n.2) are detected inside of it in the XMM–Newton image. Conversely, only X-ray source n.1 is detected in the Swift/XRT image, where the small dashed circle marks the position of the undetected X-ray source n.2. |
| In the text | |
|
Fig. 2. XMM–Newton EPIC pn image (0.2–10 keV) of the IGR J09446−2636 sky region with the ISGRI error circle at a 90% confidence (dashed) and at a 95% confidence superimposed. Two X-ray sources (n.1 and n.2) are detected inside of it. |
| In the text | |
|
Fig. 3. Swift/XRT image (0.2–10 keV) of the IGR J21268+6203 sky region with the ISGRI error circle at 90% (dashed) and 95% confidence superimposed. Only one X-ray counterpart (n.1) is detected inside of it. The smallest dashed circle marks the position of the radio/infrared counterpart previously proposed in the literature, which is undetected by Swift/XRT. |
| In the text | |
|
Fig. 4. Swift/XRT image (0.2–10 keV, obsid 00033613001 in Table 3) of the IGR J02447+7046 sky region with its IBIS/IGRI error circle at a 90% confidence (4 |
| In the text | |
|
Fig. 5. NVSS radio map at 20 cm (as taken from the NVSS team web page http://www.cv.nrao.edu/nvss/) of IGR J02447+7046 sky region. The small black circle marks the position of the Swift/XRT error circle of the best candidate X-ray counterpart of IGR J02447+7046 (source n.2 in Fig. 4). |
| In the text | |
|
Fig. 6. Distribution of log(fX/fopt) for nearby late-type stars from the NEXXUS Survey sample (Schmitt & Liefke 2004) computed following Maccacaro et al. (1988). The proposed X-ray counterparts of IGR J09446−2636 and IGR J21268+6203 are shown as red stars. Both sources lie within the stellar locus. |
| In the text | |
|
Fig. A.1. XMM–Newton EPIC pn background light curve (10-12 keV) IGR J16426+6536 extracted from a large source-free region of ObsID 0670390401 (bin time of 10 s). For any subsequent data analysis and extraction of products, we selected only the last ∼5 ks, right of the dashed, red vertical line. |
| In the text | |
|
Fig. A.2. XMM–Newton EPIC spectra of X-ray source n.2 (ObsID 0670390401) counterpart of IGR J16426+6536. The top panel shows the data fit with an absorbed power law model, while the bottom panel the ratio of the data to the model. Open (black) circles mark the pn spectrum, solid (red) stars indicates the MOS 1 spectrum and solid (green) squares mark the MOS 2 data points. The spectra have been severely binned for graphical purposes only. |
| In the text | |
|
Fig. A.3. XMM–Newton EPIC pn background light curve (10-12 keV) of IGR J09446-2636 extracted from a large source-free region of ObsID 0761112901. For any subsequent data analysis and extraction of products, we selected the time interval with a duration of ∼3 ks within the two red, dashed vertical lines (time bin = 100 s). |
| In the text | |
|
Fig. A.4. XMM–Newton EPIC spectra of X-ray source n.2 (ObsID 0761112901) counterpart of IGR J09446-2636. The top panel shows the data fit with an absorbed thermal plasma model, while the bottom panel the residuals. Open (black) circles mark the pn spectrum, solid (red) stars indicates the MOS 1 spectrum and solid (green) squares mark the MOS 2 data points. The spectra have been severely binned for graphical purposes only. |
| In the text | |
|
Fig. A.5. Swift/XRT spectrum of the newly proposed counterpart of IGR J21268+6203 from ObsID 45405006, as reported in Table 5. The residuals of the data with respect to the model are shown in the bottom panel. The spectrum has been severely binned for graphical purposes only. |
| In the text | |
Current usage metrics show cumulative count of Article Views (full-text article views including HTML views, PDF and ePub downloads, according to the available data) and Abstracts Views on Vision4Press platform.
Data correspond to usage on the plateform after 2015. The current usage metrics is available 48-96 hours after online publication and is updated daily on week days.
Initial download of the metrics may take a while.