Fig. 3
Download original image
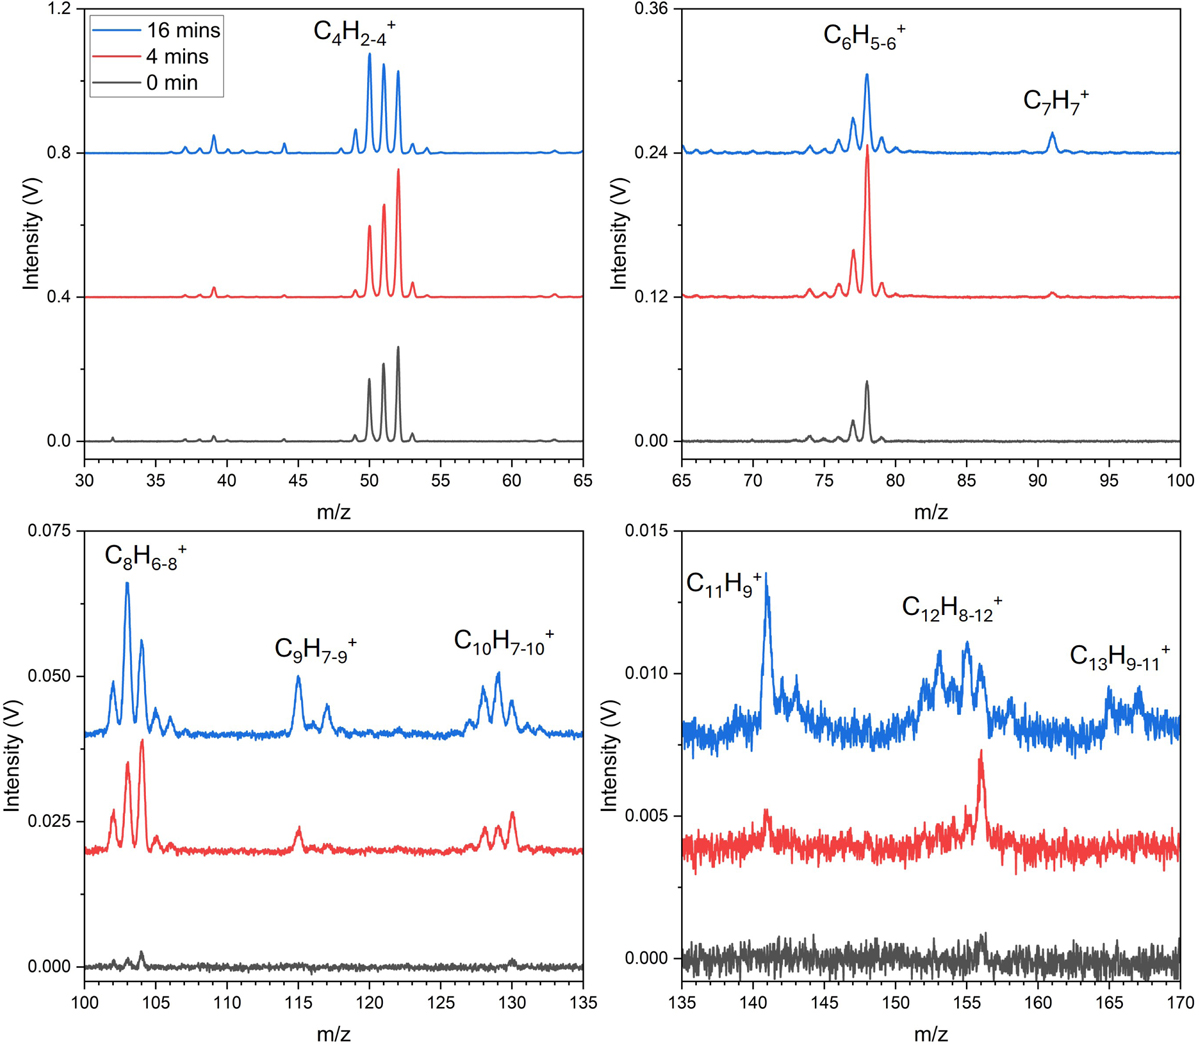
LDPI ReTOF mass spectra obtained after VUV irradiation of 100 ML thick C2H2 ice with varying VUV photon exposures of 7.2 × 10¹⁶ photons cm−2 (4 minutes) and 3 × 10¹⁷ photons cm−2 (16 minutes) are compared to the unirradiated mass spectra at 15 K. The spectra are offset for clarity. The complete list of detected mass signals is provided in Table 1.
Current usage metrics show cumulative count of Article Views (full-text article views including HTML views, PDF and ePub downloads, according to the available data) and Abstracts Views on Vision4Press platform.
Data correspond to usage on the plateform after 2015. The current usage metrics is available 48-96 hours after online publication and is updated daily on week days.
Initial download of the metrics may take a while.