| Issue |
A&A
Volume 705, January 2026
|
|
|---|---|---|
| Article Number | A229 | |
| Number of page(s) | 14 | |
| Section | Atomic, molecular, and nuclear data | |
| DOI | https://doi.org/10.1051/0004-6361/202556672 | |
| Published online | 23 January 2026 | |
In situ characterization of volatile and refractory hydrocarbons produced by UV photolysis of interstellar C2H2 ice
1
Laboratory for Astrophysics, Leiden Observatory, Leiden University,
PO Box 9513,
2300
RA Leiden,
The Netherlands
2
Leiden Observatory, Leiden University,
PO Box 9513,
2300
RA Leiden,
The Netherlands
3
Xinjiang Astronomical Observatory, Chinese Academy of Sciences,
Urumqi
830011,
China
4
Center for Interstellar Catalysis, Department of Physics and Astronomy, Aarhus University,
Aarhus
8000,
Denmark
★ Corresponding author: This email address is being protected from spambots. You need JavaScript enabled to view it.
Received:
30
July
2025
Accepted:
30
November
2025
Abstract
Context. Acetylene (C2H2) has been commonly observed in various astronomical objects, including star-forming regions, young stellar objects, and our Solar System. Theoretical and laboratory studies have proposed multiple mechanisms that link this simplest alkyne to volatile hydrocarbons and polycyclic aromatic hydrocarbons through UV- or cosmic-ray-induced energetic processes. However, it is still unclear whether refractory material can be efficiently formed through solid-state reactions involving C2H2 on dust grains.
Aims. In this work, we aim to experimentally study the chemical complexity induced by the UV irradiation of pure C2H2 ice and characterize both volatile and nonvolatile photoproducts to better understand the evolution of simple hydrocarbons under astronomically relevant conditions.
Methods. Experiments were performed using MATRI2CES, an ultra-high vacuum, cryogenic setup to investigate the C2H2 ice chemistry induced by UV photons between 7.2 and 10.2 eV at 15 K. The UV-processed ice samples were monitored in situ by laser desorption post-ionization reflection time-of-flight mass spectrometry (LDPI ReTOF-MS) in combination with the pulsed ion deflection (PID) technique. The mass spectrometric data of volatiles and refractory residues produced upon VUV photolysis of C2H2 ice were collected in situ at 15 and 300 K, respectively, minimizing uncertainties associated with external analytical methods used in previous studies.
Results. The experimental results obtained after photolysis of pure C2H2 ice with a fluence of 3 × 10¹⁷ photons cm−2 (106 years in dense clouds, show the formation of large saturated and unsaturated hydrocarbons containing up to 13 carbon atoms, including molecules identified in previous similar studies. After the sublimation of these volatile products, measurements of the residue at 300 K revealed a rich and distinct mass spectrum suggesting the synthesis of refractories composed of conjugated triple bonds (-C≡C-) and double (-C=C−) bonds. The astrochemical implications and the possible connection of the produced residues with unidentified infrared emission bands are discussed.
Key words: astrochemistry / molecular processes / solid state: refractory / solid state: volatile / methods: laboratory: solid state / ISM: molecules
Deceased; we acknowledge his contributions to this work.
© The Authors 2026
 Open Access article, published by EDP Sciences, under the terms of the Creative Commons Attribution License (https://creativecommons.org/licenses/by/4.0), which permits unrestricted use, distribution, and reproduction in any medium, provided the original work is properly cited.
This article is published in open access under the Subscribe to Open model. This email address is being protected from spambots. You need JavaScript enabled to view it. to support open access publication.
1 Introduction
Interstellar dust grains are ubiquitous throughout the interstellar medium (ISM) and play a crucial role in the processes of stellar evolution and astrochemistry (Draine 2003). In addition to blocking out the interstellar radiation field (ISRF), which results in cooler core temperatures (as low as 10 K) within interstellar clouds, dust grains also provide a third body that enables gas phase species to accrete and react via both energetic and nonenergetic means (Tielens & Hagen 1982; Hasegawa et al. 1992; Linnartz et al. 2015; Cuppen et al. 2017). This has been demonstrated by the efficient formation of H2 proposed to occur on dust grains at low temperatures (Gould & Salpeter 1963).
As molecular clouds evolve, dust grains accumulate icy mantles through the accretion of gas phase species and surface reactions on these cold grains drive the formation of both simple and complex molecular ices. These mantles are primarily composed of water (H2O), carbon monoxide (CO), ammonia (NH3), and organic molecules, such as methane (CH4) and methanol (CH3OH); readers can refer to Boogert et al. (2015) for a review. This stage of interstellar icy dust grain evolution is associated with the bottom-up formation of various hydrocarbons and complex organic molecules (COMs) via solid-state chemistry involving both non-energetic reactions, such as those driven by neutral hydrogen bombardment, energetic processes induced by secondary UV photons, and cosmic ray irradiation (Öberg et al. 2009; Modica & Palumbo 2010; Butscher et al. 2016; Öberg 2016; Chuang et al. 2017; Fedoseev et al. 2015, 2022; Cuppen et al. 2024).
Additionally, observational evidence indicates that dust grains in diffuse clouds are already coated with refractory organic residues (Sandford et al. 1991). These residues are characterized by the aliphatic C−H stretching mode at 3.4 μm and by weaker absorption features at 6.8 and 7.3 μm, corresponding to the bending modes of −CH3 and −CH2 groups (Greenberg & Shen 1999; Jones et al. 2013; Pendleton & Allamandola 2002; Dartois et al. 2004; Li & Draine 2012). Evidence for the presence of organic residues is also supported by observations of comets and analyses of carbonaceous chondrites, which are thought to preserve unaltered material from the early stages of stellar evolution (Greenberg & Shalabiea 1994; Pizzarello & Shock 2010). In the coma of comet 67P/Churyumov-Gerasimenko, hydrocarbons such as hexane (C6H14), heptane (C7H16), benzene (C6H6), and toluene (C7H8) have been detected by the ROSINA instrument on board the Rosetta space probe, with measurements alluding to the possible presence of even larger nonvolatile aliphatic and aromatic molecules (Schuhmann et al. 2019; Fedoseev et al. 2025). Additionally, solvent extracts of the carbonaceous asteroid Ryugu reveal the presence of polycyclic aromatic hydrocarbons (PAHs) and refractory organics rich in N, O, and S, along with various other hydrocarbons (Aponte et al. 2023; Schmitt-Kopplin et al. 2023; Yabuta et al. 2023).
These organic residues may form inner refractory mantles on dust grains, beneath the ice mantles that accumulate later in molecular clouds. The organic coating on dust grains can significantly modify their chemical and physical properties (Urso et al. 2020). This has been demonstrated in models showing that an increase in the sticking threshold of coated silicate grains could promote the growth of larger planetesimals. Additionally, such organic residues have been suggested to enhance the tensile strength of micro-granular pebbles (Kouchi et al. 2002; Bischoff et al. 2020).
These inner refractory residues have been suggested to form through prolonged photolysis or radiolysis of volatile hydrocarbons and other carbon-bearing species that accrete onto the surfaces of these dust grains. This can occur in dense molecular clouds where these grains with residues can be recycled to the diffuse clouds (Pendleton & Allamandola 2002; Muñoz Caro & Schutte 2003), or within the envelopes of carbon-rich asymptotic giant branch (AGB) stars, where produced gas phase hydrocarbons can condense and undergo energetic processing on dust grain surfaces before being ejected into the ISM (Ehrenfreund & Charnley 2000; Kwok 2004; Kwok & Zhang 2011; Van de Sande et al. 2021).
Within the dust-forming regions of carbon-rich AGB stars, acetylene (C2H2) has been observed to be one of the most abundant gas phase species, with abundances up to 8 × 10⁻⁵ relative to H2 (Fonfría et al. 2008). This abundance is one to two orders of magnitude higher than that of other carbon-bearing species, consistent with astrochemical models’ equilibrium predictions (Agúndez et al. 2022). In diffuse clouds and photodissociation regions (PDRs), C2H2 is thought to form through the dissociation of larger hydrocarbons or PAHs (Zhen et al. 2014; West et al. 2018; Rapacioli et al. 2018). C2H2 has been observed in various astronomical regions in the infrared, such as around massive young stellar objects (YSOs) (Lahuis & van Dishoeck 2000; van Gelder et al. 2024), around carbon stars (van Loon et al. 2006), and in disks around low-mass stars (Pascucci et al. 2009; Salyk et al. 2011). Recently, C2H2 was detected in the inner regions of many more protoplanetary disks using the JWST MidInfrared Instrument (MIRI) (van Dishoeck et al. 2023; Tabone et al. 2023; Arabhavi et al. 2024; Colmenares et al. 2024). C2H2 has also been detected within our Solar System, in the atmospheres of gas giants (Ridgway 1974; Orton et al. 1987), Saturn’s largest moon Titan and trans-Neptunian objects (TNOs) such as Pluto (Kunde et al. 1981; Gladstone et al. 2016). It has been further detected around comets Hyakutake, Halley, and 67P/Churyumov-Gerasimenko (Brooke et al. 1996; Mumma et al. 2003; Le Roy et al. 2015).
Although C2H2 is widely detected in the gas phase, its solid-state detection remains elusive (Boudin et al. 1998). The IR absorption features of C2H2 ice (at 13.7 μm) overlap with the stronger H2O ice features between 12 and 16 μm, making secure identification challenging. Laboratory IR spectroscopic data suggest that C2H2 can be reliably detected only when its concentration relative to H2O exceeds 20% (Knez et al. 2012). Nevertheless, observational and theoretical studies suggest that C2H2 ice may exist in molecular clouds. For example, measurements around massive YSOs indicate that the C2H2/H2 ratio increases from 10−8−10−9 in cooler regions to 10−6 in warmer lines of sight, suggesting possible thermal desorption of C2H2 ices (Lahuis & van Dishoeck 2000; Sonnentrucker et al. 2007). Although this increase in column density can be partly attributed to the efficient gas phase formation of C2H2 in high temperature (400−700 K) regions, which requires a high activation energy of 12 000 K (100 kJ/mol), the gas phase formation of C2H2 is consequently not as efficient in colder regions (10–300 K) (Bast et al. 2013). Furthermore, C2H2 has been shown to form in the solid state upon VUV irradiation of methane (CH4) or ethane (C2H6) ices, alluding to the presence of some C2H2 in the solid state (Lo et al. 2015; Paardekooper et al. 2016; Bulak et al. 2020; Bennett et al. 2006; Ryazantsev et al. 2018; Carrascosa et al. 2020). In planetary icy bodies, the C2H2 ice abundance is found to be about 0.1−1% relative to water (Urso et al. 2020; Hudson & Moore 1999; Rubin et al. 2019; Altwegg et al. 2019).
In addition to spectral detection constraints, the low abundance of C2H2 ice can be explained by its high chemical reactivity. Over the past two decades, C2H2 has been proposed as a key molecule leading to molecular complexity (Ahrens et al. 1994; Ehrenfreund & Sephton 2006; Oremland & Voytek 2008; Contreras & Salama 2013; Tielens 2013; Dhanoa & Rawlings 2014; Santoro et al. 2020; Lo et al. 2020; Rap et al. 2022; Chuang et al. 2024; Pentsak et al. 2024). Experiments have shown that gas phase C2H2 may be crucial in forming larger PAHs via the hydrogen abstraction-acetylene addition (HACA) mechanism (Yang et al. 2017a; Zhao et al. 2018; Reizer et al. 2022). Similarly, HACA has also been shown in the solid state, when energetically processed C2H2 ices resulted in the formation of PAHs such as chrysene (C18H12) and coronene (C24H12) (Kaiser & Roessler 1997). Apart from PAHs, UV photolysis of C2H2 molecules isolated in a neon matrix at 10 K results in the formation of linear carbon chain molecules such as C2H, C2H3, C3, C4, C4H, C4H2, C6, C8, and C8H2 (Wu & Cheng 2008). Finally, Cuylle et al. (2014) have reported the formation of polyynes (H−(C≡C)n−H) up to C20H2 upon long-term VUV irradiation of C2H2 ices.
An extensive laboratory study by Abplanalp & Kaiser (2020) investigated the chemical complexity resulting from 5 keV electron bombardment of pure C2H2 ice at 5 K and reported the formation of multiple hydrocarbon products belonging to the following chemical groups: CnH2n+2, CnH2n, CnH2n−2, CnH2n−4, CnH2n−6, CnH2n−8, CnH2n−10, CnH2n−12, CnH2n−14, and CnH2n−16 with n ≤17, along with several PAHs. These product assignments were done using single-photon ionization time-of-flight mass spectrometry (SPI ReTOF-MS) and resonance-enhanced multiphoton ionization reflectron time-of-flight mass spectrometry (REMPI ReTOF-MS) during temperature-programmed desorption (TPD) of the photoproducts until 300 K.
However, a systematic investigation of energetically processed pure C2H2 ice, which can characterize newly formed photoproducts, beyond the 300 K substrate temperature limitations, especially those that desorb above 300 K, such as the nonvolatile residues, remains unavailable. This work presents a series of systematic experiments designed to explore the chemical complexity induced by VUV irradiation of pure C2H2 ices under physical conditions representative of cold, dense regions in the interstellar medium, such as molecular clouds and circumstellar envelopes of carbon-rich AGB stars. This study presents, for the first time, the mass spectra of both volatile photoproducts and the nonvolatile residues at 15 and 300 K, respectively. The obtained results enable the study of the most pristine organic compounds that originate directly through the UV photolysis of C2H2, preserving the pristine chemical state of the residue, free from alterations by exposure to the atmosphere that typically occur during ex situ sample handling and preparation for en situ analyses. The article is organized as follows. Section 2 describes the experimental setup and the newly implemented high-sensitivity measurement approach. Section 3 presents the results and provides a discussion of their significance. Finally, Section 4 outlines the astronomical implications of the findings.
2 Experimental methodology
All experiments were carried out using a custom-made experimental setup, the mass analytical tool to research interstellar ices (MATRI2CES). The setup utilizes a well-optimized localized laser desorption post-ionization time-of-flight mass spectrometry (LDPI ReTOF-MS) to probe the VUV-irradiated C2H2 ice sample. The setup has been introduced and detailed in previous studies (Paardekooper et al. 2014; Samarth et al. 2024). The description of the setup and applied experimental methodology relevant to this work is provided in the following section.
2.1 Setup description
MATRI2CES is a cryogenic, ultra-high vacuum (UHV) experimental setup with a base pressure of the mid 10−10 mbar, comprising two chambers, the main chamber and the ToF chamber separated by a UHV gate valve. Within the main chamber, the C2H2 gas is deposited onto a gold-plated copper substrate at an incident angle of 5 degrees through a metal capillary tube using a pre-calibrated, high-precision leak valve. The substrate is mounted on the cold finger of a closed-cycle helium cryostat, which sits on a UHV X−Y manipulator. The temperature of the substrate can be regulated in the range from 15 to 300 K using resistive heating coils.
For our experiments, 100 monolayers (ML) of pure C2H2 ice were deposited on the substrate; 1 ML of ice is assumed to have a column density of 1015 molecules cm−2. The ice thickness is calculated from the ice deposition rate, which is estimated through laser interferometry using a frequency-stabilized He−Ne laser (632.8 nm) positioned at an angle of 2 degrees to the normal of the substrate. The reflected laser intensity is measured by a photodiode over time as the ice film grows. The absolute ice thickness (d) is calculated from the number of fringes observed in the interference pattern (Hudgins et al. 1993) using the equation
 (1)
where m is the number of fringes, λ is the wavelength of the laser, nice is the refractive index of the C2H2 ice at 15 K, taken as 1.34 (Hudson et al. 2014; Abplanalp & Kaiser 2020), and θice is the angle of incidence (2°). The ice density values of 0.76 g cm−3 (Hudson et al. 2014), reported in the literature are used to convert the measured absolute ice thicknesses into the corresponding column densities. The molecule deposition rate is derived by dividing the obtained column density by its deposition time.
(1)
where m is the number of fringes, λ is the wavelength of the laser, nice is the refractive index of the C2H2 ice at 15 K, taken as 1.34 (Hudson et al. 2014; Abplanalp & Kaiser 2020), and θice is the angle of incidence (2°). The ice density values of 0.76 g cm−3 (Hudson et al. 2014), reported in the literature are used to convert the measured absolute ice thicknesses into the corresponding column densities. The molecule deposition rate is derived by dividing the obtained column density by its deposition time.
All experiments were performed using high-purity (4 N) C2H2 (Linde 5% in helium). The grown C2H2 ice samples are exposed to VUV photons produced by a microwave discharge hydrogen lamp (MDHL) and guided through a magnesium fluoride (MgF2) viewport. The estimated flux of the applied MDHL is (3 ± 0.5) × 1014 photons cm−2 s−1 at the substrate plane characterized with two main emission bands at 121.6 nm(10.2 eV) and 140−170 nm(7.2−8.9 eV) (Ligterink et al. 2015), mimicking the secondary UV emissions produced by the interaction of cosmic rays with the abundant H2 in molecular clouds (Prasad & Tarafdar 1983).
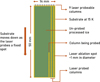 |
Fig. 1 Schematic illustration of the ablation scheme used at the MATRI2CES setup. The laser fires at 5 Hz while the substrate is moved downward by a motorized Y-translator, ensuring a fresh spot is probed with each shot. |
2.2 LDPI ReTOF-MS technique
After VUV processing, a portion of the ice is probed by pulsing a Nd:YAG laser (New Wave Research, Polaris II) at its third harmonic (355 nm) onto the substrate. The laser pulse locally desorbs a small spot (approximately 1 mm in diameter, as set by a manually controlled aperture) from the substrate, transferring the ice constituents into the gas phase via flash heating in a short pulse of 3−5 ns. This ablation produces a short-lived (μs) gas plume (Henderson & Gudipati 2014), which is immediately ionized by a continuously operating, tunable electron beam (Jordan C-950), positioned in parallel to the substrate. This electron energy is set to 70 eV to obtain corresponding mass fragments that can be directly compared with the National Institute of Standards and Technology (NIST) database (Linstrom & Mallard 2001; Bulak et al. 2021). The generated ions are then guided into the ToF chamber, operated in the reflection mode to enhance mass resolution, by a set of ion optics, including a repeller plate, extraction grid, and deflection plate which work together to direct the ions into the field-free drift tube and travel toward a micro-channel plate (MCP) detector. The detected ion signals are recorded using a data acquisition card (DAQ) at a sampling rate of 2.5 GHz. The laser pulse, ion extraction, and data acquisition sequence are controlled through a delay generator (Stanford DG-535) and the acquired data is processed through a LabVIEW program. During laser ablation at 5 Hz, the substrate is moved vertically, in sync with a stepper motor-controlled linear translator, so that each laser shot probes a fresh spot on the substrate. In each column measurement, around 1 mm wide, 100 mass spectra are collected and averaged into a single mass spectrum to improve the signal-to-noise ratio. Once a measurement is complete, the substrate returns to its original vertical position and is moved horizontally by 1.5 mm using a hand-cranked translator so that the laser probing process can be repeated for another fresh column of ice. This experimental procedure enables the acquisition of mass spectra for multiple columns across the substrate as a function of VUV irradiation fluence without repeating the experiment for different UV irradiation times. Given that the substrate’s width is 14 mm, in total, 9 mass spectra (columns) can be probed and collected during the irradiation of the same ice sample. The substrate, probed columns, and the laser-probed spots are illustrated in Fig. 1.
Additionally, with a recent upgrade to MATRI2CES, a pulsed ion deflection (PID) method was implemented to overcome the signal saturation limitation of the ReTOF-MS. Signal saturation occurs when the high abundance of the parent molecular ions causes the detector to saturate at an intensity of approximately 1 V. This hinders the detection of the newly formed species produced in much smaller quantities. With the PID method, this saturation is overcome by applying a variable short voltage (50 V) pulse to the deflection plates, controlled by a second delay generator (Stanford DG 535). By precisely controlling the deflection time between 0.2 and 1 μ s, the most abundant m/z signals are selectively deflected away from reaching the MCP detector. This technique has been experimentally shown to increase the MCP sensitivity by approximately 30 times in a previous study on the UV photolysis of methanol (CH3OH) ice sample (Samarth et al. 2024).
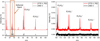 |
Fig. 2 LDPI ReTOF-mass spectra recorded with PID at an increased voltage of 2775 V (Red) and without PID at a base voltage of 2480 V (Black). Both spectra are obtained for 100 ML thick unirradiated C2H2 ice at 15 K. The high sensitivity mass spectrum shows a wealth of spectral features belonging to C2H2 clusters at masses m/z=52(C2H2)2+, 78(C2H2)3+, 104(C2H2)4+, 130(C2H2)5+, 156(C2H2)6+, and 182(C2H2)7+. |
3 Results and discussion
3.1 LDPI ReTOF-MS of pure C2H2 ice
The averaged LDPI ReTOF mass spectrum of pure C2H2 ice 100 ML thick at 15 K, obtained with and without PID setting, is shown in Fig. 2. The reference mass spectrum (Fig. 2, black trace) collected at a sensitivity of 2480 V, shows the fragmentation pattern of pure C2H2 ice using 70 eV ionization energy displays peaks at m/z=12(C+), 13(CH+), 14(CH2+), 24(C2+), 25(C2H+), and 26(C2H2+). In addition, the ion signals of C2H2 clusters (C2H2)n+, at masses m/z=52 and m/z=78 for n=2 and 3 are evident. Hereafter, we refer to the detector voltage readings as the intensity.
In the present work, PID was implemented by applying a precisely controlled voltage pulse of 0.5 μ s with a calibrated delay of 2.426 μ s after the ion extraction was triggered. The trigger timing and duration are set to deflect the majority of C2H2 fragment signals between masses m/z=23 and 27 without affecting the rest of the mass spectrum. As a result, the mass spectrum exhibits significantly reduced intensities for these parent ions, enabling an increase in the MCP bias voltage from 2480 V to 2775 V. The resulting mass spectrum (Fig. 2, red trace) shows a notable decrease in the intensity of parent ion peaks between m/z=23 and 27 relative to their intensities in the reference spectrum, even at a higher sensitivity of 2775 V. Moreover, the PID enhanced spectrum reveals not only an increase in the intensity of previously observed peaks belonging to C2H2 clusters at masses m/z=52 and 78, but also the appearance of a higherorder (C2H2)n+cluster peaks at m/z=104,130,156, and 182 for n=4,5,6, and 7, respectively. The assignment of these C2H2 clusters is confirmed by performing a series of controlled experiments, which are summarized in Fig. A.1. Similar C2H2 cluster formations have been observed in previous studies of post-ionized supersonic C2H2 beam expansion with small signal at masses m/z=37, 38, 39, and 63 (Momoh et al. 2006; El-Shall 2008; Relph et al. 2009).
3.2 VUV irradiation of pure C2H2 ice at 15 K
The C2H2 ice samples were irradiated at 15 K for up to 64 minutes of VUV irradiation. This corresponds to a VUV-photon fluence of ∼ 1.2 × 10¹⁸ photons cm−2. During irradiation, changes in the ice were monitored by recording mass spectra at fixed time intervals of 4,8,16,32, and 64 minutes. Fig. 3 shows the selected mass spectra obtained after 4 (red) and 16 (blue) minutes of irradiation of 100 ML-thick pure C2H2 ice, together with the mass spectrum of unirradiated C2H2 ice as a reference (black). These irradiation times correspond to an exposure of ∼ 7 × 10¹⁶ photons cm−2 and ∼ 3 × 10¹⁷ photons cm−2, respectively. The UV photolysis of pure C2H2 ice can lead to both photodesorption and photoconversion at 20 K. The 16-minute irradiation spectrum shows the maximum intensity of photoproduct signals within the recorded mass range between m/z=30 and 170, while the 4-minute irradiation spectrum provides a representative snapshot of the early photochemistry of primary and secondary ice constituents.
In the 4-minute (red trace) irradiation spectrum in Fig. 3, a rapid formation of photoproducts with an even number of C atoms can be observed in the mass ranges between m/z=50 and 52(C4H2−4), 77 and 78(C6H5−8), 102 and 104(C8H6−8), 127 and 130(C10H7−10), and 152 and 156(C12H8−12). This observation is in line with the efficient radical polymerization (or cyclization) reactions, reported by Cuylle et al. (2014). In addition to hydrocarbons with even numbers of carbon atoms, relatively weak signals corresponding to odd-carbon hydrocarbons are also observed at m/z=91(C7H7), m/z=115(C9H7), m/z=141 (C11H9), and m/z=165(C13H9) suggesting a slower formation process. As these photoproducts consist exclusively of elemental carbon and hydrogen originating from C2H2, the most intense peaks can be assigned according to their C/H compositions and are labeled in Fig. 3. A complete assignment of all peaks is provided in Table 1. As C2H2 ice is progressively depleted upon VUV irradiation, the overall abundance of (C2H2)n+clusters is expected to decline with it. In our mass spectra, where the intensities of photoproduct mass fragments (Fig. 3, red and blue traces) significantly exceed those of the unirradiated C2H2 clusters (Fig. 3, black trace), we do not consider them in our analysis.
Table 1 lists all photoproducts detected after 16 minutes of irradiation of pure C2H2 at 15 K, sorted by carbon atom count (first column), m/z values in descending order (second column), and corresponding elemental compositions (third column). The relatively intense peaks (intensity >50% compared to the strongest peak in each group) are further highlighted in boldface. The fourth column shows the aromatic molecules unambiguously identified by Abplanalp & Kaiser (2020) through application of REMPI ReTOF-MS and the fifth column shows other molecules suggested in this work based on the identifications of Abplanalp & Kaiser (2020). This study confirms the presence of all parent molecular mass signals corresponding to aromatic hydrocarbons, including m/z=78(C6H6., benzene), m/z=102(C8H6., phenylacetylene), m/z=104(C8H8., phenylethylene), and m/z=128(C10H8., naphthalene), as previously shown by REMPI ReTOF-MS after 5 keV electron irradiation of C2H2 ice at 5 K.
Besides these confirmed hydrocarbons, the intense signals at m/z=50,51,52 can be securely assigned to C4H2 (diacetylene) and C4H4 (vinylacetylene) molecules, which are two common chemical derivatives originating from C2H2+(Willis et al. 1977; Pereira et al. 2020; Chuang et al. 2021). Similarly, the assignment of m/z=78,77,79 signals to linear hexadienyne (C6H6), along with the previous assignment to cyclic benzene, can be considered. It is noted that LDPI ReTOF-MS alone does not allow for the discrimination between the linear and cyclic conjugated unsaturated hydrocarbons due to the possible internal isomerization of ions analyzed by TOF-MS. Therefore, hereafter, the preference is given to the assignments of molecules identified by Abplanalp & Kaiser (2020) using REMPI ReTOF-MS, and to the search for their possible derivatives.
The intense signals at m/z=91,115,117,141,153,155, and 165 are abundantly observed in the post-16-minute irradiation spectrum. Based on the structure of PAHs identified in Abplanalp & Kaiser (2020), several other substituted PAHs with CnHm side groups, such as CH3,−C2H,−C2H3,−C2H5, −C3H3, can be expected, for example, methylbenzene (toluene, C6H5CH3), phenylmethylacetylene (C6H5 CCCH3), methylnaphthalene (C10H7CH3), vinylnaphthalene (C10H7 C2H3), ethylnaphthalene (C10H7 C2H5) with molecular ions at m/z=92,116,142, 154,156, respectively. It is noted that a systematic m/z=1 shift exists between the aforementioned species and the mass signals observed in the experiments. This is consistent with a loss of a single H atom upon dissociative ionization or the loss of any other side-substituted (-R) groups, hinting at the presence of complicated aliphatic chains attached to these observed PAH rings. For example, the mass signal at m/z=91, the tropylium ion (C7H7), is a major ion fragment in the mass spectra of many substituted arenes (hydrocarbons that contain at least one benzene ring), including ethylbenzene (C8H10), butylbenzene (C10H14), and xylene (C8H10).
The most intense signals observed in the mass range of m/z=76 and 80 suggest the presence of aromatic structures based on the mass spectra available on the NIST database. This can be illustrated by comparing the mass fragmentation patterns of a PAH mentioned in this work, naphthalene (C10H8, m/z= 128), which exhibits a dominant peak at m/z=128 with only minor dissociative ionization fragments in the lower mass range, with its isobaric aliphatic counterpart, nonane (C9H20, m/z= 128) which yields a cascade of lower-mass fragments, most of which are not seen in our collected mass spectrum with negligible signal at m/z=128; shown in Appendix B. The intense mass signal at m/z=115(C9H7) corresponds to the most intense mass fragment signal of substituted indenes, a benzene ring fused with a cyclopentene ring. Similarly, the most intense mass signal at m/z=165(C13H9) corresponds to the phenalene derivative (C13H10), one of the simplest true PAHs. It is important to note that, because LDPI ReTOF-MS is not optimized to record mass spectra of the ice sample during irradiation and cannot resolve the overlapping thermal desorption temperatures of the complex suite of photoproducts, these assignments are considered tentative. A quantitative assessment of photodesorption and photoconversion, as well as a detailed TPD analysis, is beyond the scope of the present work and will require a dedicated future study.
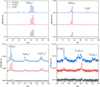 |
Fig. 3 LDPI ReTOF mass spectra obtained after VUV irradiation of 100 ML thick C2H2 ice with varying VUV photon exposures of 7.2 × 10¹⁶ photons cm−2 (4 minutes) and 3 × 10¹⁷ photons cm−2 (16 minutes) are compared to the unirradiated mass spectra at 15 K. The spectra are offset for clarity. The complete list of detected mass signals is provided in Table 1. |
3.3 Refractory residues at 300 K
Two types of dedicated experiments were performed to probe the nonvolatile organic residues produced by the irradiation of C2H2 ice at 15 K. In the first type of experiment, the irradiated C2H2 ice samples obtained at 15 K are gently warmed to 300 K at a constant rate of 2.5 K min−1 and kept isotherm until the main chamber pressure reaches the base 10−10 mbar range. Consequently, the LDPI ReTOF mass spectrum of the refractory residue was acquired as shown in Fig. 4. In the second type of experiments, the obtained refractory residue is kept overnight at 300 K in order to achieve the complete degassing of the obtained residue and elimination of the desorbed species from the gas phase. Then the refractory residues were cooled down to 15 K, and the LDPI ReTOF mass spectra were obtained. In this way, the mass spectra with the lowest possible contribution of the main chamber background gas constituents are obtained; shown in Appendix D Fig. D,1. In both sets of experiments, the MCP detector bias voltage was increased from 2775 to 3000 V to enhance the mass signals of the present residue, as due to the absence of parent ice and volatile product constituents after annealing, there was no risk of detector saturation. It was found that both measurements result in the acquisition of qualitatively very similar mass spectra. The mass spectra collected after waiting overnight carry an additional mass signal of H2O. Moreover, the obtained mass spectra of the nonvolatile residues are qualitatively similar for all of the applied experimental conditions.
Fig. 4 shows the mass spectra of the refractory organic residue at 300 K obtained after irradiation of 100 ML thick pure C2H2 ice with a total fluence of 3 × 10¹⁷ photons cm−2. The main refractory peaks are grouped and labeled with their corresponding chemical formulas. A full list of peak assignments is provided in Table 2. Similar to Table 1, ion signals are organized by the number of carbon atoms (first column), followed by m/z values listed in descending order of intensity (second column). The third column shows the corresponding chemical formulas in the same order. The fourth column suggests possible key functional groups or fragments, assuming they result from the dissociative ionization of larger molecules present in the residue.
The residue mass spectrum exhibits a series of mass peak groups with an average separation of 12−13 m/z units, which corresponds to the mass of a C atom or a-CH-group. Such periodicity suggests that the produced residue predominantly consists of conjugated unsaturated hydrocarbon units, characterized by alternating triple bonds (-C≡C-) and double bonds (-CH=CH-) with segments of m/z=24 and m/z=26, respectively. In Fig. 4, mass peaks between m/z=30 and 105 display a broader variation in hydrogenation levels by up to 8 m/z units. This hints at the presence of several aliphatic unsaturated fragments alongside aromatic fragments in the mass spectrum. For example, the presence of peaks at m/z=50 and m/z=74 can be attributed to the polyynic structures such as C4H2 and C6H2, respectively. While the peaks at m/z=51 and m/z=75 can be assigned to polyenyne fragments, such as C4H3 and C6H3, for example, aliphatic fragments comprised of both triple and double carbon-carbon bonds. Among the odd carbon number ions, the most intense signals correspond to C3H3(m/z=39), C5H3(m/z=63), and C7H3(m/z=87). Appearance of these signals is in line with the presence of methylpolyyne segments in the parent ionized species. Additionally, the characteristic m/z signals corresponding to the resonance-stabilized cyclic ions are evident, with notable peaks including aforementioned C3H3 at m/z=39, C6H5 at m/z=65, and C7H7 at m/z=91. Although the former ion may also originate from the aliphatic propargyl (-CH2-C≡CH), propynyl (-C≡C-CH3) or even allenyl (-HC=C=CH2) groups.
Beyond m/z=105, the degree of hydrogenation decreases, and the observed peak groups tend to be dominated by a few, well-defined peaks. This observation hints at the presence of polycyclic aromatic hydrocarbons (PAHs) and their substituted derivatives. For instance, the strong signal at m/z=128 corresponds to naphthalene (C10H8), a well-known aromatic hydrocarbon. Similarly, the m/z=178 and 202 signals, the most intense within their groups, correspond to phenanthrene (or anthracene) and pyrene, respectively. The m/z signals of 115 and 165 can be assigned to indenyl (C9H7, m/z=115) and phenalenyl (C13H9., m/z=165), respectively.
On the other hand, all the aforementioned m/z values corresponding to aromatic ions at m/z=63,115,128,165,178, and 202, can be obtained by the sum of identified aliphatic ions, shown in Table 2. Indeed, the m/z=77 fragment assigned to the phenyl group may correspond to contributions from benzene (C6H6) derivatives or various hexadiyne or hexadienyne groups, such as R−CH2-C≡C-CH2-C≡CH, R−C≡C-CH2− C≡C-CH3, R−C≡C-CH2-CH2-C≡CH (all are m/z=39+38= 77) or R−CH=CH−CH=CH−C≡CH, R−C≡C-CH=CH−CH=CH2, R−CH=CH−C≡C-CH=CH2 (all are m/z=50 (51) +27 (26) (deflected)=77). Similarly, the m/z=128 value assigned to naphthalene can be obtained by various substituted benzol fragments or even non-aromatic polyyne fragments. It should be noted that application of LDPI ReTOF-MS does not allow for the distinction between the cumulenic molecules (molecules containing 3 or more consecutive double bonds between C atoms) and polyynic structures (Cernicharo et al. 2021). The preference for the assignment of polyynes and polyenynes is given due to the higher stability of these isomers and the high excess energy of VUV-photon absorption-induced reactions involved in the experiments. Despite the many aliphatic and aromatic candidates for our mass spectra, the exact aliphatic to aromatic product ratios cannot be determined using our experimental technique.
The preference for the partial assignment of aromatic fragments is supported by the identification of benzol, phenylacetylene, styrene, naphthalene, and phenanthrene among the volatile products of C2H2 ice radiolysis by Abplanalp & Kaiser (2020) and the consistency of their results with this work, shown in section 3.2. Abplanalp & Kaiser (2020) reports a relatively large span of possible ratios between the primary aliphatic product vinylacetylene and the primary aromatic product benzene, ranging from 8 to 0.5, depending on the applied detection technique, shown in Tables 5 and 6 of Abplanalp & Kaiser (2020). This converges into the ratio from 5 to 0.1 for the number of carbon atoms locked in the vinylacetylene and benzene, respectively. The reported abundances of substituted arenes and large PAHs are at least a factor of a few lower than those of benzene. Unfortunately, Abplanalp & Kaiser (2020) does not report the abundances of 6-carbon-bearing aliphatic species, which is likely caused by the limitation of the applied techniques. Nevertheless, the composition of the produced organic residues should reflect the volatile inventory produced upon irradiation of C2H2 ice. Therefore, the presence of aromatic fragments with ratios similar to those reported by Abplanalp & Kaiser (2020) may be expected for our obtained residues.
The photostability of the produced organic residue upon VUV-irradiation is measured in this work as a function of VUV fluence. Fig. 5 presents the mass spectra of five different organic residues exposed to five different VUV irradiation doses. All five residues are obtained on the same substrate by irradiation of 100 ML thick pure C2H2 ice in the following way. The first residue is obtained by ablating volatile components from a first column of the ice, after a total of 4 minutes (∼ 7 × 10¹⁶ photons cm−2 or ∼ 7 eV per molecule) of irradiation. Similarly, a second residue is obtained by ablating volatile ice components from a second fresh column after 8 minutes (∼ 1.4 × 10¹⁷. photons cm−2 or ∼ 14 eV per molecule) of irradiation. The procedure is repeated until the ablation of the last column after 64 minutes (1.2 × 10¹⁸ photons cm−2 or ∼ 120 eV per molecule) of irradiation. Since the substrate, including the produced residues, was continuously exposed to VUV-photon fluence over the entire duration of the experiment, the residue produced after 4 minutes of irradiation was exposed to a total of ∼ 1.13 × 10¹⁸ photons cm−2 of VUV exposure. Similarly, the residue obtained after a total of 8 minutes of irradiation was exposed to a total of ∼ 1.06 × 10¹⁸ photons cm−2 of total VUV exposure, and so on. The LDPI ReTOF mass spectra of the residues are collected at 15 K following an annealing overnight at 300 K. The obtained mass spectra were normalized to the intensity of mass m/z=50 for easier relative comparison. All acquired residue mass spectra presented in Fig. 5 are qualitatively identical except for a weak signal appearing on the final spectrum at m/z=73. This indicates that the formation of organic residues occurs very early during the irradiation process upon receiving several eV (1–7) per molecule irradiation dose. Moreover, the produced organic residue remains qualitatively unchanged upon prolonged irradiation by about 1 × 10¹⁸ of total VUV photon fluence.
List of detected photoproducts.
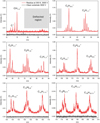 |
Fig. 4 LDPI ReTOF-MS of the organic residue produced by VUV irradiation of 100 ML thick C2H2 with a total fluence of 3 × 10¹⁷ photons cm−2 fluence at 15 K. The mass spectrum is acquired at 300 K upon the annealing of the ice at an increased detector voltage of 3000 V. The complete list of detected mass signals is provided in Table 2. The deflected region is the mass range between m/z=18 and 34 where the ions are deflected upon the use of the PID technique. |
List of detected organic residues.
4 Astrophysical implications and conclusions
In this experimental work, we confirm the efficient formation of several low-volatile hydrocarbons, including polycyclic aromatic hydrocarbons (PAHs), by investigating the UV photolysis of pure C2H2 ices at 15 K. The experimental results are in line with previous works using 5 keV electron bombardment of C2H2 ice; shown in Table 1. We also characterize several ML thick organic refractory residues produced by irradiation of C2H2 ice under ultra-high vacuum conditions. The organic residues are, for the first time, characterized in situ by LDPI ReTOF-MS after annealing the processed ice sample at 300 K. This approach preserves the pristine chemical composition upon VUV irradiation by avoiding chemical alteration caused by exposure to atmospheric conditions.
PAH formation in the ISM has drawn considerable attention over the past decades and has been proposed as a potential molecular carrier for the unidentified infrared emission (UIE) bands (Li & Greenberg 1997; Tielens 2008; Kwok & Zhang 2011). This attention has increased by both the recent detection of the first individual aromatic molecules in the ISM (McGuire et al. 2018, 2021; Wenzel et al. 2025; Cernicharo et al. 2021; Burkhardt et al. 2021) and by the high predicted abundances of PAHs in the ISM. PAHs have been suggested to contribute to dust grain formation, VUV shielding in star-forming regions, catalytic properties, and the formation of refractory organic residues. They have been suggested to be important precursors of many complex organic molecules, including prebiotic molecules (Greenberg et al. 2000; Ehrenfreund & Cami 2010; Accolla et al. 2018). The formation of PAHs is generally explained via a topdown or bottom-up formation mechanism, depending on the environment (Reizer et al. 2022; Concepción et al. 2023). In the top-down mechanism, the formation of PAHs is attributed to the fragmentation or destruction of larger carbon allotropes such as graphite, graphene, large PAHs, and carbon nanoparticles (Merino et al. 2014; Boersma et al. 2013, 2015). On the other hand, the bottom-up mechanism proposes that PAHs can be formed in the ISM from simple hydrocarbons. Gaseous C2H2, abundant in the outflows of carbon-rich stars together with its derivatives C2H, serves as one of the possible building blocks for PAH synthesis upon UV photolysis or radiolysis by energetic particles (Abplanalp & Kaiser 2020; Zhang et al. 2023; Pentsak et al. 2024; Yang et al. 2016).
In this work, the formation of large unsaturated hydrocarbons containing up to 13 carbon atoms is found in the VUV-processed C2H2 with a fluence of approximately 1−10 × 1017 photons cm−2. This corresponds to a timescale of roughly 3 × 10⁵−3 × 10⁶ years in dense molecular clouds with a UV flux of about 104 photons cm−2 s−1 (Prasad & Tarafdar 1983). The identified PAH products align with the outcome of the similar work by Abplanalp & Kaiser (2020) using REMPI ReTOF-MS following bombardment of pure (C2H2) ice by 5 keV electrons at 5 K. All the characteristic mass signals corresponding to benzene (C6H6), phenylacetylene (C8H6), styrene (C8H8), naphthalene (C10H8), and phenanthrene (C14H10) are securely observed in the LDPI ReTOF mass spectra obtained at 15 K without warming up the processed ice samples. However, some internal isomerization of unsaturated aliphatic hydrocarbon ions into more stable aromatic formats upon electron impact cannot be completely excluded. For the same reason, the degree of aromaticity among the photolysis products cannot be derived. Abplanalp & Kaiser (2020) demonstrate a wide range of possible ratios between the number of carbon atoms incorporated in the two main polymerization products, aliphatic and aromatic, ranging from 5 to 0.1. Nevertheless, their results clearly hint at the mixed aliphatic-aromatic nature of the obtained radiolysis products. Similarly, the refractory organic residues produced by our UV photolysis of pure C2H2 ice at 15 K are inferred to have mixed aliphatic-aromatic composition. By carefully analyzing the dissociative mass fragments, the residues formed in our experiments are predominantly composed of conjugated unsaturated triple bonds (-C≡C−) and double bonds (>C=C<). Moreover, the obtained mass spectra are dominated by mass signals characteristic of aromatic dissociative ionization fragments, suggesting the presence of aromatic structures containing one to four fused rings (see Table 2 for details).
Based on the qualitative data from the residual compound analysis, two possible refractory structures are proposed in Fig. 6. Fig. 6a corresponds to the structure featuring aliphatic carbon chains with a low degree of aromaticity. Various functional groups attached to the base carbonaceous compound, as evidenced by the detection of mass signals listed in Table 2, are highlighted by different colors. Alternatively, Fig. 6b depicts the refractory structure which is rich in (fused) aromatic rings. Likewise, the substituted functional groups responsible for the observed signals are highlighted in different colors. It should be noted that both proposed residual structures demonstrate a good match with possible carriers for the unidentified infrared emission features illustrated in Yang et al. (2017b). These are interstellar hydrogenated amorphous carbon (HAC) (Duley et al. 1989; Jones et al. 1990), and to some extent, quenched carbonaceous composite (QCC) (Sakata et al. 1990) and mixed aromatic-aliphatic organic nanoparticles (MAON) structures. The latter two structures contain O and N atoms, which are missing in pure C2H2 photolysis experiments. Irradiation of C2H2 with inclusions of O- and N-bearing species can be the subject of future studies.
In the UV photolysis experiments presented in this work, the organic residues are synthesized at the beginning of VUV exposure with a fluence of 7 × 10¹⁶ photons cm−2 and remain chemically stable with some changes in intensity, as seen in Fig. 5. This result suggests a strong photostability of the produced organic residues, which could likely be preserved on interstellar dust grains during stellar evolution. This is in line with the initial hypothesis that photostable refractory organic residues are produced on the surface of interstellar dust by energetic processing of icy mantles (Pendleton & Allamandola 2002; Muñoz Caro & Schutte 2003; Ehrenfreund & Charnley 2000; Kwok 2004). Another important result is the acquisition of nm thick organic residues compared to previous experimental studies where residue formation was mainly observed after energetic processing of micrometer-thick volatile ices, such as carrying mixtures of CO: NH3: H2O: CH3OH: CO2 (Greenberg et al. 2000; Ehrenfreund & Sephton 2006; Accolla et al. 2018). In this work, VUV photolysis of 100 ML thick (∼ 30 nm) ice, representative of observational ice thicknesses in the ISM (Boogert et al. 2015), leads to abundant detection of organic residue within the typical molecular cloud timescale of 106 years. Modeling results obtained for the outflows of carbon-rich AGB stars estimate ice thicknesses which are of a fraction of ML in the outer cold part of the circumstellar envelope (Van de Sande et al. 2019, 2020, 2021).
This study serves as a proof-of-principle experiment, demonstrating that refractory organic residues with astrophysical significance can be synthesized from astronomically thin ices and characterized under carefully controlled UHV conditions, without external contaminants. This study also provides insights into what the inner refractory mantles would look like on dust grains. Future experiments will extend these techniques to more astrophysically realistic ice mixtures, including multiple volatile species relevant to dense molecular clouds. Additionally, complementary techniques such as FTIR or Raman spectroscopy can be used to characterize the residues and nonvolatile photoproducts. Such follow-up studies will provide deeper insights into the complexity of refractory materials produced in diverse astrophysical environments and their potential roles in prebiotic chemistry.
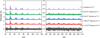 |
Fig. 5 LDPI ReTOF-MS of the organic residue produced upon VUV irradiation of C2H2 ice at 15 K, exposed to further VUV fluence is shown. The fluence in the legend indicates the total photon fluence the formed residue was exposed to after the ice over a specific column was ablated, effectively halting the residue formation over that column. All the mass spectra were normalized to m/z=50, for comparison. |
 |
Fig. 6 Two proposed residual structures originating from the UV photolysis of C2H2 ice: (a) low degrees of aromaticity and (b) high degrees of aromaticity. Some of the dissociative ionization fragments are shown in different colors. These substituted functional groups are: m/z=39 (red), m/z=51 (orange), m/z=53 (yellow), m/z=63 (green), m/z=65 (turquoise), m/z=77 (blue), m/z=91 (violet), m/z=115 (lavender), m/z=127 (pink), m/z=201(brown). The molecules are presented in two-dimensional flat structures for simplicity. |
Acknowledgements
This work has been supported by the Danish National Research Foundation through the Center of Excellence InterCat (Grant Agreement No. DNRF150). It has also been funded by the Dutch Astrochemistry Network II (DANII) and NOVA (the Netherlands Research School for Astronomy). G.F. acknowledges the Xinjiang Tianchi Talent Program (2024).
References
- Abplanalp, M. J., & Kaiser, R. I., 2020, ApJ, 889, 3 [Google Scholar]
- Accolla, M., Pellegrino, G., Baratta, G. A., et al. 2018, A&A, 620, A123 [NASA ADS] [CrossRef] [EDP Sciences] [Google Scholar]
- Agúndez, M., Marcelino, N., Cabezas, C., et al. 2022, A&A, 657, A96 [NASA ADS] [CrossRef] [EDP Sciences] [Google Scholar]
- Ahrens, J., Bachmann, M., Baum, T., et al. 1994, Int. J. Mass Spectrom. Ion Process., 138, 133 [Google Scholar]
- Altwegg, K., Balsiger, H., & Fuselier, S. A., 2019, Annu. Rev. Astron. Astrophys., 57, 113 [Google Scholar]
- Aponte, J. C., Dworkin, J. P., Glavin, D. P., et al. 2023, Earth Planets Space, 75, 28 [Google Scholar]
- Arabhavi, A. M., Kamp, I., Henning, T., et al. 2024, Science, 384, 1086 [NASA ADS] [CrossRef] [Google Scholar]
- Bast, J. E., Lahuis, F., van Dishoeck, E. F., & Tielens, A. G. G. M., 2013, A&A, 551, A118 [NASA ADS] [CrossRef] [EDP Sciences] [Google Scholar]
- Bennett, C. J., Jamieson, C. S., Osamura, Y., & Kaiser, R. I., 2006, ApJ, 653, 792 [Google Scholar]
- Bischoff, D., Kreuzig, C., Haack, D., Gundlach, B., & Blum, J., 2020, MNRAS, 497, 2517 [CrossRef] [Google Scholar]
- Boersma, C., Bregman, J. D., & Allamandola, L. J., 2013, ApJ, 769, 117 [NASA ADS] [CrossRef] [Google Scholar]
- Boersma, C., Bregman, J., & Allamandola, L. J., 2015, ApJ, 806, 121 [NASA ADS] [CrossRef] [Google Scholar]
- Boogert, A. A., Gerakines, P. A., & Whittet, D. C., 2015, ARA&A, 53, 541 [Google Scholar]
- Boudin, N., Schutte, W. A., & Greenberg, J. M., 1998, A&A, 331, 749 [NASA ADS] [Google Scholar]
- Brooke, T. Y., Tokunaga, A. T., Weaver, H. A., et al. 1996, Nature, 383, 606 [NASA ADS] [CrossRef] [Google Scholar]
- Bulak, M., Paardekooper, D. M., Fedoseev, G., & Linnartz, H., 2020, A&A, 636, A32 [NASA ADS] [CrossRef] [EDP Sciences] [Google Scholar]
- Bulak, M., Paardekooper, D. M., Fedoseev, G., & Linnartz, H., 2021, A&A, 647, A82 [NASA ADS] [CrossRef] [EDP Sciences] [Google Scholar]
- Burkhardt, A. M., Long Kelvin Lee, K., Bryan Changala, P., et al. 2021, ApJ, 913, L18 [NASA ADS] [CrossRef] [Google Scholar]
- Butscher, T., Duvernay, F., Danger, G., & Chiavassa, T., 2016, A&A, 593, A60 [NASA ADS] [CrossRef] [EDP Sciences] [Google Scholar]
- Carrascosa, H., Cruz-Díaz, G. A., Muñoz Caro, G. M., Dartois, E., & Chen, Y.-J., 2020, MNRAS, 493, 821 [CrossRef] [Google Scholar]
- Cernicharo, J., Agúndez, M., Cabezas, C., et al. 2021, A&A, 649, L15 [EDP Sciences] [Google Scholar]
- Chuang, K.-J., Fedoseev, G., Qasim, D., et al. 2017, MNRAS, 467, 2552 [Google Scholar]
- Chuang, K.-J., Fedoseev, G., Scirè, C., et al. 2021, A&A, 650, A85 [NASA ADS] [CrossRef] [EDP Sciences] [Google Scholar]
- Chuang, K.-J., Jäger, C., Santos, J. C., & Henning, T., 2024, A&A, 687, A7 [NASA ADS] [CrossRef] [EDP Sciences] [Google Scholar]
- Colmenares, M. J., Bergin, E. A., Salyk, C., et al. 2024, ApJ, 977, 173 [NASA ADS] [CrossRef] [Google Scholar]
- Concepción, J. G. d. l., Jiménez-Serra, I., Rivilla, V. M., Colzi, L., & Martín-Pintado, J. 2023, A&A, 673, A118 [NASA ADS] [CrossRef] [EDP Sciences] [Google Scholar]
- Contreras, C. S., & Salama, F., 2013, ApJS, 208, 6 [NASA ADS] [CrossRef] [Google Scholar]
- Cuppen, H. M., Walsh, C., Lamberts, T., et al. 2017, Space Sci. Rev., 212, 1 [Google Scholar]
- Cuppen, H. M., Linnartz, H., & Ioppolo, S., 2024, ARA&A, 62, 243 [Google Scholar]
- Cuylle, S. H., Zhao, D., Strazzulla, G., & Linnartz, H., 2014, A&A, 570, A83 [NASA ADS] [CrossRef] [EDP Sciences] [Google Scholar]
- Dartois, E., Muñoz Caro, G. M., Deboffle, D., & d’Hendecourt, L., 2004, A&A, 423, L33 [NASA ADS] [CrossRef] [EDP Sciences] [Google Scholar]
- Dhanoa, H., & Rawlings, J. M. C., 2014, MNRAS, 440, 1786 [Google Scholar]
- Draine, B. T., 2003, ARA&A, 41, 241 [Google Scholar]
- Duley, W. W., Jones, A. P., & Williams, D. A., 1989, MNRAS, 236, 709 [NASA ADS] [Google Scholar]
- Ehrenfreund, P., & Cami, J., 2010, Cold Spring Harb. Perspect. Biol., 2, a002097 [CrossRef] [Google Scholar]
- Ehrenfreund, P., & Charnley, S. B., 2000, ARA&A, 38, 427 [Google Scholar]
- Ehrenfreund, P., & Sephton, M. A., 2006, Faraday Discuss., 133, 277 [Google Scholar]
- El-Shall, M. S., 2008, Acc. Chem. Res., 41, 783 [Google Scholar]
- Fedoseev, G., Cuppen, H. M., Ioppolo, S., Lamberts, T., & Linnartz, H., 2015, MNRAS, 448, 1288 [NASA ADS] [CrossRef] [Google Scholar]
- Fedoseev, G., Qasim, D., Chuang, K.-J., et al. 2022, ApJ, 924, 110 [NASA ADS] [CrossRef] [Google Scholar]
- Fedoseev, G., Li, X., Baratta, G. A., Palumbo, M. E., & Chuang, K.-J. 2025, A&A, 682, A277 [Google Scholar]
- Fonfría, J. P., Cernicharo, J., Richter, M. J., & Lacy, J. H., 2008, ApJ, 673, 445 [CrossRef] [Google Scholar]
- Gladstone, G. R., Stern, S. A., Ennico, K., et al. 2016, Science, 351, aad8866 [Google Scholar]
- Gould, R. J., & Salpeter, E. E., 1963, ApJ, 138, 393 [NASA ADS] [CrossRef] [Google Scholar]
- Greenberg, J. M., & Shalabiea, O. M., 1994, IAU Symp., 160, 327 [Google Scholar]
- Greenberg, J. M., & Shen, C., 1999, Astrophys. Space Sci., 269, 33 [Google Scholar]
- Greenberg, J. M., Gillette, J. S., Muñoz Caro, G. M., et al. 2000, ApJ, 531, L71 [NASA ADS] [CrossRef] [Google Scholar]
- Hasegawa, T. I., Herbst, E., & Leung, C. M., 1992, ApJS, 82, 167 [Google Scholar]
- Henderson, B. L., & Gudipati, M. S., 2014, J. Phys. Chem. A, 118, 5454 [NASA ADS] [CrossRef] [Google Scholar]
- Hudgins, D. M., Sandford, S. A., Allamandola, L. J., & Tielens, A. G. G. M., 1993, ApJS, 86, 713 [NASA ADS] [CrossRef] [Google Scholar]
- Hudson, R. L., & Moore, M. H., 1999, Icarus, 140, 451 [NASA ADS] [CrossRef] [Google Scholar]
- Hudson, R. L., Ferrante, R. F., & Moore, M. H., 2014, Icarus, 228, 276 [NASA ADS] [CrossRef] [Google Scholar]
- Jones, A. P., Duley, W. W., & Williams, D. A., 1990, QJRAS, 31, 567 [Google Scholar]
- Jones, A. P., Fanciullo, L., Köhler, M., et al. 2013, A&A, 558, A62 [NASA ADS] [CrossRef] [EDP Sciences] [Google Scholar]
- Kaiser, R. I., & Roessler, K., 1997, ApJ, 475, 144 [Google Scholar]
- Knez, C., Moore, M. H., Ferrante, R. F., & Hudson, R. L., 2012, ApJ, 748, 95 [NASA ADS] [CrossRef] [Google Scholar]
- Kouchi, A., Kudo, T., Nakano, H., et al. 2002, ApJ, 566, L121 [Google Scholar]
- Kunde, V. G., Aikin, A. C., Hanel, R. A., et al. 1981, Nature, 292, 686 [NASA ADS] [CrossRef] [Google Scholar]
- Kwok, S., 2004, Nature, 430, 985 [NASA ADS] [CrossRef] [Google Scholar]
- Kwok, S., & Zhang, Y., 2011, Nature, 479, 80 [NASA ADS] [CrossRef] [Google Scholar]
- Lahuis, F., & van Dishoeck, E. F., 2000, A&A, 355, 699 [NASA ADS] [Google Scholar]
- Le Roy, L. L., Altwegg, K., Balsiger, H., et al. 2015, A&A, 583, A1 [NASA ADS] [CrossRef] [EDP Sciences] [Google Scholar]
- Li, A., & Draine, B. T., 2012, ApJ, 760, L35 [NASA ADS] [CrossRef] [Google Scholar]
- Li, A., & Greenberg, J. M., 1997, A&A, 323, 566 [NASA ADS] [Google Scholar]
- Ligterink, N. F. W., Paardekooper, D. M., Chuang, K. J., et al. 2015, A&A, 584, A56 [NASA ADS] [CrossRef] [EDP Sciences] [Google Scholar]
- Linnartz, H., Ioppolo, S., & Fedoseev, G., 2015, Int. Rev. Phys. Chem., 34, 205 [Google Scholar]
- Linstrom, P. J., & Mallard, W. G., 2001, J. Chem. Eng. Data, 46, 1059 [CrossRef] [Google Scholar]
- Lo, J.-I., Lin, M.-Y., Peng, Y.-C., et al. 2015, MNRAS, 451, 159 [Google Scholar]
- Lo, J.-I., Peng, Y.-C., Chou, S.-L., Lu, H.-C., & Cheng, B.-M. 2020, MNRAS, 499, 543 [Google Scholar]
- McGuire, B. A., Burkhardt, A. M., Kalenskii, S., et al. 2018, Science, 359, 202 [Google Scholar]
- McGuire, B. A., Loomis, R. A., Burkhardt, A. M., et al. 2021, Science, 371, 1265 [Google Scholar]
- Merino, P., Švec, M., Martinez, J. I., et al. 2014, Nat. Commun., 5, 3054 [NASA ADS] [CrossRef] [Google Scholar]
- Modica, P., & Palumbo, M. E., 2010, A&A, 519, A22 [NASA ADS] [CrossRef] [EDP Sciences] [Google Scholar]
- Momoh, P. O., Abrash, S. A., Mabrouki, R., & Samy El-Shall, M., 2006, J. Am. Chem. Soc., 128, 12408 [Google Scholar]
- Mumma, M. J., DiSanti, M. A., Dello Russo, N., et al. 2003, Adv. Space Res., 31, 2563 [NASA ADS] [CrossRef] [Google Scholar]
- Muñoz Caro, G. M., & Schutte, W. A., 2003, A&A, 412, 121 [NASA ADS] [CrossRef] [EDP Sciences] [Google Scholar]
- Öberg, K. I., 2016, Chem. Rev., 116, 9631 [Google Scholar]
- Öberg, K. I., Garrod, R. T., van Dishoeck, E. F., & Linnartz, H. 2009, A&A, 504, 891 [NASA ADS] [CrossRef] [EDP Sciences] [Google Scholar]
- Oremland, R. S., & Voytek, M. A., 2008, Astrobiology, 8, 45 [Google Scholar]
- Orton, G. S., Aitken, D. K., Smith, C., et al. 1987, Icarus, 70, 1 [NASA ADS] [CrossRef] [Google Scholar]
- Paardekooper, D. M., Bossa, J. B., Isokoski, K., & Linnartz, H., 2014, Rev. Sci. Instrum., 85, 104501 [NASA ADS] [CrossRef] [Google Scholar]
- Paardekooper, D. M., Bossa, J.-B., & Linnartz, H., 2016, A&A, 592, A67 [NASA ADS] [CrossRef] [EDP Sciences] [Google Scholar]
- Pascucci, I., Apai, D., Luhman, K., et al. 2009, ApJ, 696, 143 [Google Scholar]
- Pendleton, Y. J., & Allamandola, L. J., 2002, ApJS, 138, 75 [NASA ADS] [CrossRef] [Google Scholar]
- Pentsak, E. O., Murga, M. S., & Ananikov, V. P., 2024, ACS Earth Space Chem., 8,798 [Google Scholar]
- Pereira, R. C., deBarros, A. L. F., daCosta, C. A. P., et al. 2020, MNRAS, 495, 40 [Google Scholar]
- Pizzarello, S., & Shock, E., 2010, Cold Spring Harb. Perspect. Biol., 2, a002105 [CrossRef] [Google Scholar]
- Prasad, S. S., & Tarafdar, S. P., 1983, ApJ, 267, 603 [Google Scholar]
- Rap, D. B., Schrauwen, J. G. M., Marimuthu, A. N., Redlich, B., & Brünken, S., 2022, Nat. Astron., 6, 1059 [Google Scholar]
- Rapacioli, M., Cazaux, S., Foley, N., et al. 2018, Phys. Chem. Chem. Phys., 20, 22427 [NASA ADS] [CrossRef] [Google Scholar]
- Reizer, E., Viskolcz, B., & Fiser, B., 2022, Chemosphere, 291, 132793 [NASA ADS] [CrossRef] [Google Scholar]
- Relph, R. A., Bopp, J. C., Roscioli, J. R., & Johnson, M. A., 2009, J. Chem. Phys., 131, 114305 [Google Scholar]
- Ridgway, S. T., 1974, ApJ, 187, L41 [NASA ADS] [CrossRef] [Google Scholar]
- Rubin, M., Altwegg, K., Balsiger, H., et al. 2019, MNRAS, 489, 594 [Google Scholar]
- Ryazantsev, S. V., Zasimov, P. V., & Feldman, V. I., 2018, Radiat. Phys. Chem., 151, 253 [Google Scholar]
- Sakata, A., Wada, S., Onaka, T., & Tokunaga, A. T., 1990, ApJ, 353, 543 [Google Scholar]
- Salyk, C., Pontoppidan, K. M., Blake, G. A., Najita, J. R., & Carr, J. S., 2011, ApJ, 731, 130 [Google Scholar]
- Samarth, P., Bulak, M., Paardekooper, D., Chuang, K.-J., & Linnartz, H., 2024, Rev. Sci. Instrum., 95, 023304 [Google Scholar]
- Sandford, S. A., Allamandola, L. J., Tielens, A. G. G. M., et al. 1991, ApJ, 371, 607 [NASA ADS] [CrossRef] [Google Scholar]
- Santoro, G., Martínez, L., Lauwaet, K., et al. 2020, ApJ, 895, 97 [CrossRef] [Google Scholar]
- Schmitt-Kopplin, P., Hertkorn, N., Harir, M., et al. 2023, Nat. Commun., 14, 6525 [Google Scholar]
- Schuhmann, M., Altwegg, K., Balsiger, H., et al. 2019, A&A, 630, A31 [NASA ADS] [CrossRef] [EDP Sciences] [Google Scholar]
- Sonnentrucker, P., González-Alfonso, E., & Neufeld, D. A., 2007, ApJ, 671, L37 [NASA ADS] [CrossRef] [Google Scholar]
- Tabone, B., Bettoni, G., van Dishoeck, E. F., et al. 2023, Nat. Astron., 7, 805 [NASA ADS] [CrossRef] [Google Scholar]
- Tielens, A. G. G. M., 2008, ARA&A, 46, 289 [Google Scholar]
- Tielens, A. G. G. M., 2013, Rev. Mod. Phys., 85, 3 [Google Scholar]
- Tielens, A. G. G. M., & Hagen, W., 1982, A&A, 114, 245 [Google Scholar]
- Urso, R. G., Vuitton, V., Danger, G., et al. 2020, A&A, 644, A115 [NASA ADS] [CrossRef] [EDP Sciences] [Google Scholar]
- Van de Sande, M., Walsh, C., Mangan, T. P., & Decin, L., 2019, MNRAS, 490, 2023 [Google Scholar]
- Van de Sande, M., Walsh, C., & Danilovich, T., 2020, MNRAS, 495, 1650 [Google Scholar]
- Van de Sande, M., Walsh, C., & Millar, T. J., 2021, MNRAS, 501, 491 [Google Scholar]
- van Dishoeck, E. F., Grant, S., Tabone, B., et al. 2023, Faraday Discuss., 245, 52 [NASA ADS] [CrossRef] [Google Scholar]
- van Gelder, M. L., Francis, L., van Dishoeck, E. F., et al. 2024, A&A, 692, A197 [NASA ADS] [CrossRef] [EDP Sciences] [Google Scholar]
- van Loon, J. T., Marshall, J. R., Cohen, M., et al. 2006, A&A, 447, 971 [NASA ADS] [CrossRef] [EDP Sciences] [Google Scholar]
- Wenzel, G., Speak, T. H., Changala, P. B., et al. 2025, Nat. Astron., 9, 262 [Google Scholar]
- West, B., Castillo, S. R., Sit, A., et al. 2018, Phys. Chem. Chem. Phys., 20, 7195 [Google Scholar]
- Willis, C., Back, R. A., & Morris, R. H., 1977, Can. J. Chem., 55, 3288 [Google Scholar]
- Wu, Y.-J., & Cheng, B.-M. 2008, Chem. Phys. Lett., 461, 53 [Google Scholar]
- Yabuta, H., Cody, G. D., Engrand, C., et al. 2023, Science, 379, eabn9057 [Google Scholar]
- Yang, T., Troy, T. P., Xu, B., et al. 2016, Angew. Chem. Int. Ed., 55, 14983 [Google Scholar]
- Yang, T., Kaiser, R. I., Troy, T. P., et al. 2017a, Angew. Chem. Int. Ed., 56, 4515 [Google Scholar]
- Yang, X. J., Li, A., Glaser, R., & Zhong, J. X. 2017b, ApJ, 837, 171 [Google Scholar]
- Zhang, C., Wang, J., Turner, A. M., et al. 2023, ApJ, 952, 132 [NASA ADS] [CrossRef] [Google Scholar]
- Zhao, L., Kaiser, R. I., Xu, B., et al. 2018, Nat. Astron., 2, 413 [Google Scholar]
- Zhen, J., Paardekooper, D. M., Candian, A., Linnartz, H., & Tielens, A. G. G. M., 2014, Chem. Phys. Lett., 592, 211 [CrossRef] [Google Scholar]
The m/z values with the relative intensity of >50% are in bold font.
Appendix A Acetylene cluster ions versus hydrocarbon impurities
Fig. A.1 presents three LDPI ReTOF mass spectra obtained in a set of control experiments aimed at confirming that the mass features found in our pure unirradiated C2H2 ice mass spectrum obtained at 15 K (see Fig. 2) above m/z=30 were indeed caused by C2H2 clusters rather than contaminants. The red spectrum is obtained for 100 ML thick C2H2 ice after deposition at 15 K and warm up to 60 K. The blue spectrum is obtained after a similar deposition and warm-up to 80 K. The 60 K and 80 K substrate temperatures lie before and after the thermal desorption temperature of pure C2H2 ice at 78 K under our applied UHV conditions. The mass spectrum at 15 K before the deposition of the pure C2H2 ice is presented for comparison. To ensure reliable comparison between spectra and reduce experimental uncertainties, all measurements were conducted using the same instrumental settings except for the substrate temperature. The spectrum presented in Fig. A.1 reveals an absence of any hydrocarbon mass signals for both the pre-deposition mass spectra obtained at 15 K (black trace) and post-deposition mass spectra of C2H2 ice heated to 80 K (blue trace). The mass spectrum at 80 K contains trace signals of H2O ice and leftover C2H2 at masses m/z=18 and 26, respectively. The mass spectrum obtained after the C2H2 ice is warmed up to 60 K (red) shows identical mass features to the mass spectrum of the pure C2H2 ice obtained at 15 K, shown in Fig. 2. This confirms that the peaks seen in the mass spectra of C2H2 ice at 15 K, especially the peaks at higher masses, must come from C2H2 ice clustering upon laser ablation, rather than contaminants from the gas bottle or interactions with the ion optics of the setup.
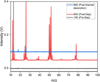 |
Fig. A.1 Comparison of the LDPI ReTOF mass spectrum of a clean substrate, obtained before the deposition of C2H2 ice at 15 K (black), a spectrum of 100 ML thick C2H2 ice obtained after the deposition at 15 K and warmed up to 60 K (red), and the spectrum obtained after annealing of the same C2H2 ice at 80 K (blue). The thermal desorption temperature of pure C2H2 ice under our applied UHV conditions is about 78 K. The presence of hydrocarbon features in the mass spectrum obtained at 60 K and their absence in the spectrum collected at 80 K is consistent with the assignment of signals above m/z=28 to the acetylene cluster ions (C2H2)n+, where n=2,3, …, 7. |
Appendix B Excluding large saturated aliphatic hydrocarbons
Fig. B.1 presents a comparison between the mass spectrum of an unsaturated aromatic hydrocarbon, naphthalene (C10H8) and a fully saturated aliphatic hydrocarbon, nonane (C9H20). These two hydrocarbons are isobaric, each exhibiting a molecular mass of 128 amu. The mass spectrum of nonane is dominated by signals in the lower mass region, especially around m/z=35 to m/z=65. In contrast, the mass spectrum of naphthalene is dominated by a few m/z signals around the parent ion m/z=128. The LDPI ReTOF mass spectra obtained after VUV-irradiation of pure C2H2 ice are comprised of several narrow groups of m/z signals in the higher mass range (m/z>75), which are more consistent with the presence of various unsaturated (aromatic) hydrocarbons.
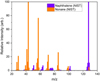 |
Fig. B.1 Comparison between the mass spectra of two isobaric hydrocarbons with m/z=128, naphthalene (C10H8., in purple), and nonane (C9H20., in orange). The mass spectra are obtained from the National Institute of Standards and Technology (NIST) database (Linstrom & Mallard 2001). |
Appendix C Uniformity of the residue
Fig. C.1 presents the LDPI ReTOF mass spectra acquired from five distinct columns on the substrate. The spectra were collected for the residue formed after the VUV irradiation of pure C2H2 ice with a fluence of 6 × 10¹⁷ photons cm−2 (32 minutes of irradiation). The mass spectra were collected following overnight annealing of the substrate at 300 K and subsequent cooling to 15 K, in order to maximize the thermal desorption of volatiles and minimize the contamination from residual chamber gases. The mass features at m/z=17 and m/z=18 arise from the water H2O ice deposited on the substrate upon cooling down to 15 K. To highlight the uniformity of the mass spectral features of the produced residue and their relative intensities across the substrate, the spectra are presented as collected, without normalization. The mass spectra recorded across the five sampled columns on the substrate exhibit qualitatively identical mass features, with only minor fluctuations in peak intensities varying from column to column. This high degree of spectral consistency suggests that the chemical composition of the residue is largely uniform across the substrate.
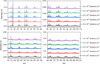 |
Fig. C.1 Comparison of the LDPI ReTOF mass spectra of the residue produced after VUV irradiating C2H2 ice with 6 × 10¹⁷ photons cm−2. The mass spectra, obtained at 15 K after annealing overnight at 300 K, are shown across multiple laser-probed columns on the substrate. This figure showcases the uniformity of peaks and consistency of the formed residue across 5 columns probed on the substrate. |
All Tables
All Figures
|
Fig. 1 Schematic illustration of the ablation scheme used at the MATRI2CES setup. The laser fires at 5 Hz while the substrate is moved downward by a motorized Y-translator, ensuring a fresh spot is probed with each shot. |
| In the text | |
|
Fig. 2 LDPI ReTOF-mass spectra recorded with PID at an increased voltage of 2775 V (Red) and without PID at a base voltage of 2480 V (Black). Both spectra are obtained for 100 ML thick unirradiated C2H2 ice at 15 K. The high sensitivity mass spectrum shows a wealth of spectral features belonging to C2H2 clusters at masses m/z=52(C2H2)2+, 78(C2H2)3+, 104(C2H2)4+, 130(C2H2)5+, 156(C2H2)6+, and 182(C2H2)7+. |
| In the text | |
|
Fig. 3 LDPI ReTOF mass spectra obtained after VUV irradiation of 100 ML thick C2H2 ice with varying VUV photon exposures of 7.2 × 10¹⁶ photons cm−2 (4 minutes) and 3 × 10¹⁷ photons cm−2 (16 minutes) are compared to the unirradiated mass spectra at 15 K. The spectra are offset for clarity. The complete list of detected mass signals is provided in Table 1. |
| In the text | |
|
Fig. 4 LDPI ReTOF-MS of the organic residue produced by VUV irradiation of 100 ML thick C2H2 with a total fluence of 3 × 10¹⁷ photons cm−2 fluence at 15 K. The mass spectrum is acquired at 300 K upon the annealing of the ice at an increased detector voltage of 3000 V. The complete list of detected mass signals is provided in Table 2. The deflected region is the mass range between m/z=18 and 34 where the ions are deflected upon the use of the PID technique. |
| In the text | |
|
Fig. 5 LDPI ReTOF-MS of the organic residue produced upon VUV irradiation of C2H2 ice at 15 K, exposed to further VUV fluence is shown. The fluence in the legend indicates the total photon fluence the formed residue was exposed to after the ice over a specific column was ablated, effectively halting the residue formation over that column. All the mass spectra were normalized to m/z=50, for comparison. |
| In the text | |
|
Fig. 6 Two proposed residual structures originating from the UV photolysis of C2H2 ice: (a) low degrees of aromaticity and (b) high degrees of aromaticity. Some of the dissociative ionization fragments are shown in different colors. These substituted functional groups are: m/z=39 (red), m/z=51 (orange), m/z=53 (yellow), m/z=63 (green), m/z=65 (turquoise), m/z=77 (blue), m/z=91 (violet), m/z=115 (lavender), m/z=127 (pink), m/z=201(brown). The molecules are presented in two-dimensional flat structures for simplicity. |
| In the text | |
|
Fig. A.1 Comparison of the LDPI ReTOF mass spectrum of a clean substrate, obtained before the deposition of C2H2 ice at 15 K (black), a spectrum of 100 ML thick C2H2 ice obtained after the deposition at 15 K and warmed up to 60 K (red), and the spectrum obtained after annealing of the same C2H2 ice at 80 K (blue). The thermal desorption temperature of pure C2H2 ice under our applied UHV conditions is about 78 K. The presence of hydrocarbon features in the mass spectrum obtained at 60 K and their absence in the spectrum collected at 80 K is consistent with the assignment of signals above m/z=28 to the acetylene cluster ions (C2H2)n+, where n=2,3, …, 7. |
| In the text | |
|
Fig. B.1 Comparison between the mass spectra of two isobaric hydrocarbons with m/z=128, naphthalene (C10H8., in purple), and nonane (C9H20., in orange). The mass spectra are obtained from the National Institute of Standards and Technology (NIST) database (Linstrom & Mallard 2001). |
| In the text | |
|
Fig. C.1 Comparison of the LDPI ReTOF mass spectra of the residue produced after VUV irradiating C2H2 ice with 6 × 10¹⁷ photons cm−2. The mass spectra, obtained at 15 K after annealing overnight at 300 K, are shown across multiple laser-probed columns on the substrate. This figure showcases the uniformity of peaks and consistency of the formed residue across 5 columns probed on the substrate. |
| In the text | |
Current usage metrics show cumulative count of Article Views (full-text article views including HTML views, PDF and ePub downloads, according to the available data) and Abstracts Views on Vision4Press platform.
Data correspond to usage on the plateform after 2015. The current usage metrics is available 48-96 hours after online publication and is updated daily on week days.
Initial download of the metrics may take a while.