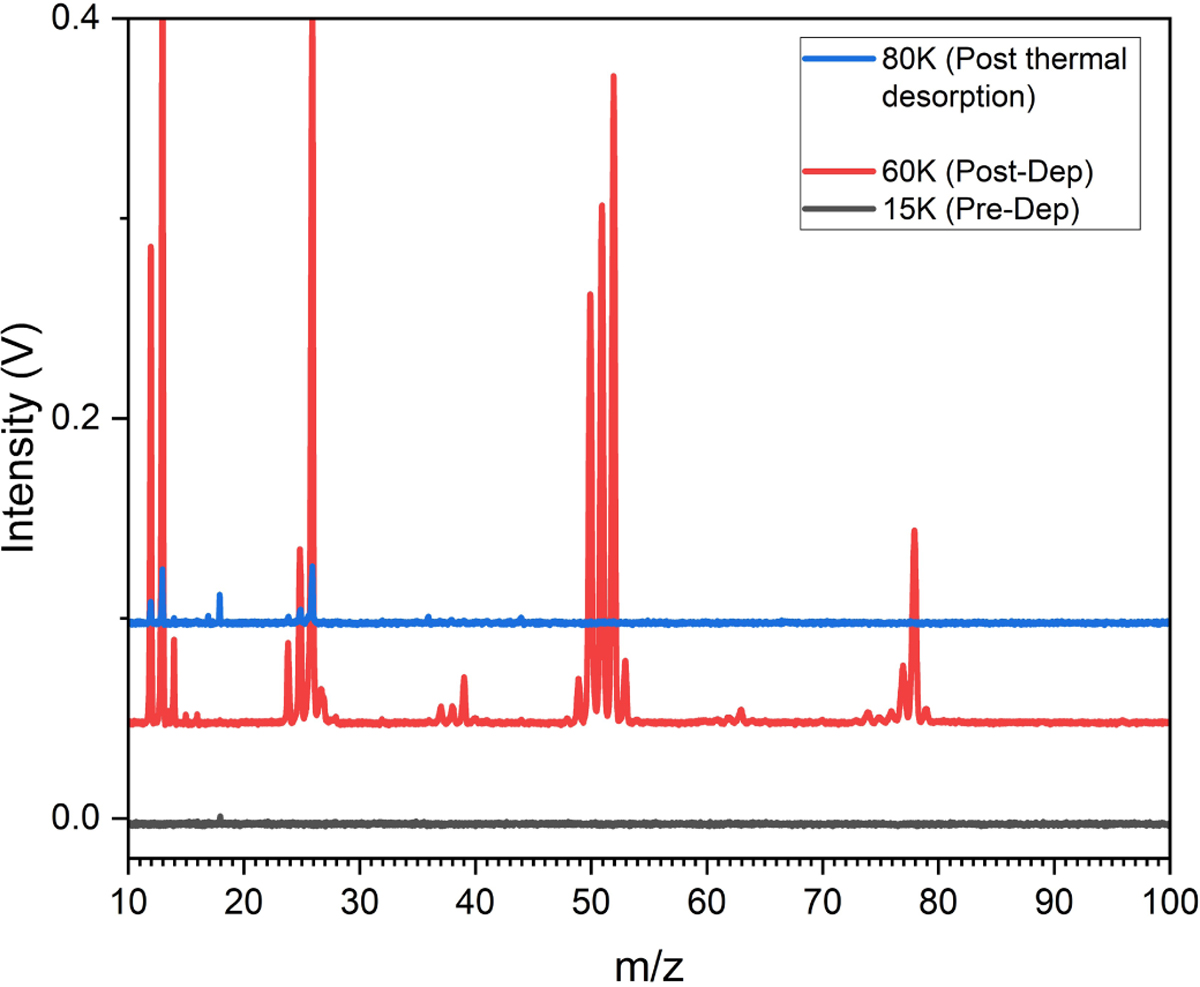
Fig. A.1
Download original image
Comparison of the LDPI ReTOF mass spectrum of a clean substrate, obtained before the deposition of C2H2 ice at 15 K (black), a spectrum of 100 ML thick C2H2 ice obtained after the deposition at 15 K and warmed up to 60 K (red), and the spectrum obtained after annealing of the same C2H2 ice at 80 K (blue). The thermal desorption temperature of pure C2H2 ice under our applied UHV conditions is about 78 K. The presence of hydrocarbon features in the mass spectrum obtained at 60 K and their absence in the spectrum collected at 80 K is consistent with the assignment of signals above m/z=28 to the acetylene cluster ions (C2H2)n+, where n=2,3, …, 7.
Current usage metrics show cumulative count of Article Views (full-text article views including HTML views, PDF and ePub downloads, according to the available data) and Abstracts Views on Vision4Press platform.
Data correspond to usage on the plateform after 2015. The current usage metrics is available 48-96 hours after online publication and is updated daily on week days.
Initial download of the metrics may take a while.