Open Access
Fig. D.2.
Download original image
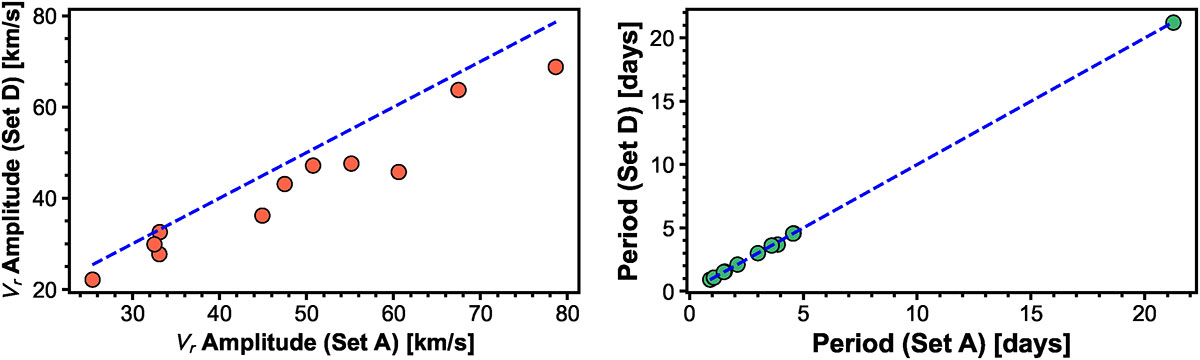
Comparison of surface velocity amplitude (on the left) and period (on the right) between set A and set D equiv models. While the periods and light curve amplitudes show good agreement, some differences are noted in the surface velocity amplitudes.
Current usage metrics show cumulative count of Article Views (full-text article views including HTML views, PDF and ePub downloads, according to the available data) and Abstracts Views on Vision4Press platform.
Data correspond to usage on the plateform after 2015. The current usage metrics is available 48-96 hours after online publication and is updated daily on week days.
Initial download of the metrics may take a while.