Fig. 6.
Download original image
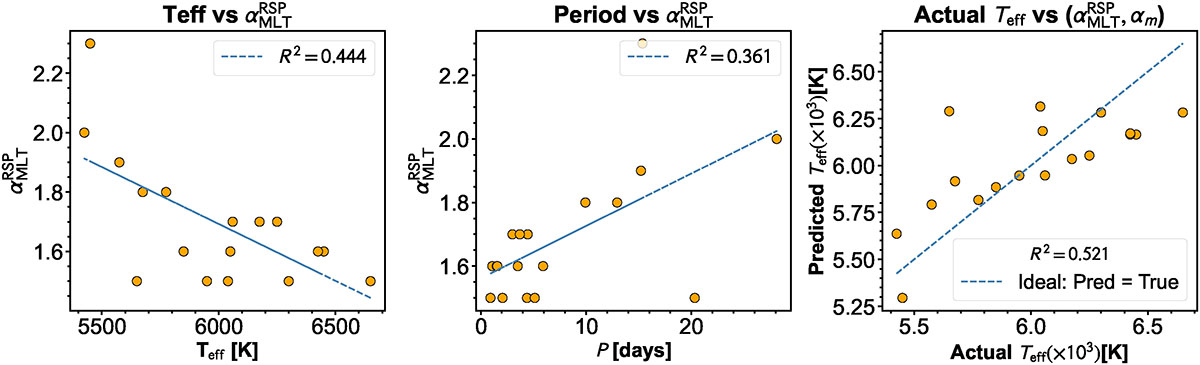
Correlations between the stellar parameters and the TC parameters (![]() and αm) for cases with R2 > 0.3. The left and middle panels display linear regressions (red dashed lines) along with the corresponding R2 values. Among all comparisons, only the relationships between
and αm) for cases with R2 > 0.3. The left and middle panels display linear regressions (red dashed lines) along with the corresponding R2 values. Among all comparisons, only the relationships between ![]() and effective temperature or period, as well as between
and effective temperature or period, as well as between ![]() , αm, and Teff, exhibit moderate correlations. Most other parameter combinations show weak or no significant correlation.
, αm, and Teff, exhibit moderate correlations. Most other parameter combinations show weak or no significant correlation.
Current usage metrics show cumulative count of Article Views (full-text article views including HTML views, PDF and ePub downloads, according to the available data) and Abstracts Views on Vision4Press platform.
Data correspond to usage on the plateform after 2015. The current usage metrics is available 48-96 hours after online publication and is updated daily on week days.
Initial download of the metrics may take a while.