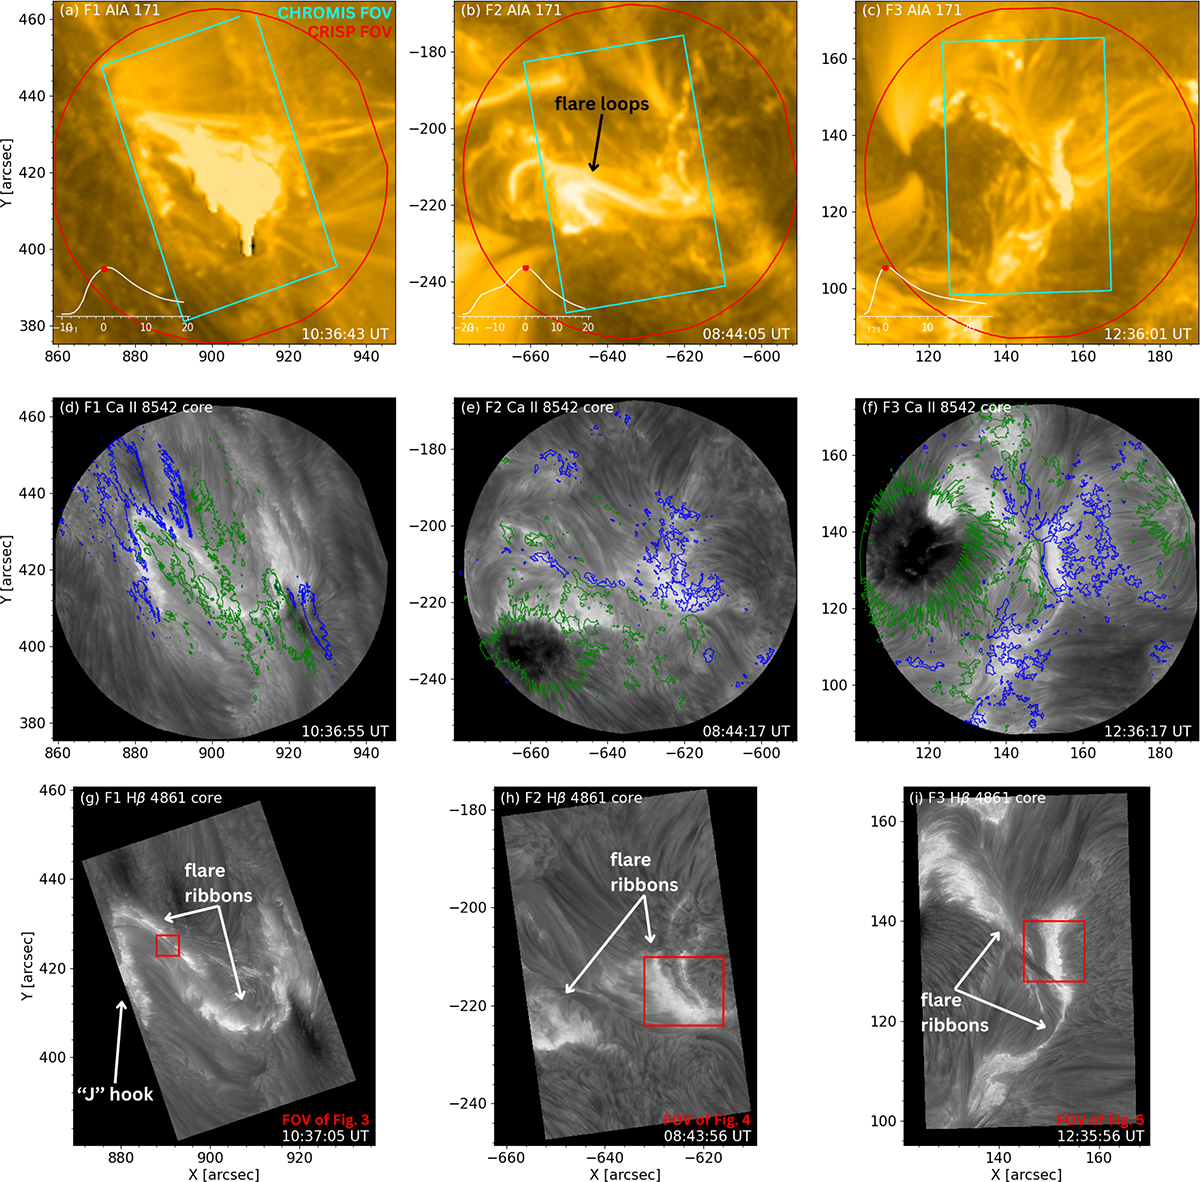
Fig. 1.
Download original image
Context of the ARs that generated the flares. The columns from left to right show the M4.6, C8.3, and M1.8 flares, respectively. The rows from top to bottom show the AIA 171 Å, Ca II 8542 Å core and Hβ core channels, respectively. Each panel show the flare near the GOES peak time, and the timestamps are shown in the lower right corners. The GOES X-ray plot is added in the lower left corner in the upper row, where the x axis is in minutes relative to the image. The red and cyan contours highlight the FOVs of CRISP and CHROMIS, respectively. The green and blue contours in the middle row show the CRISP magnetogram at ±500 G. The red boxes in the lower row correspond to the FOVs in Figs. 3–5, respectively. An animation of this figure is available online.
Current usage metrics show cumulative count of Article Views (full-text article views including HTML views, PDF and ePub downloads, according to the available data) and Abstracts Views on Vision4Press platform.
Data correspond to usage on the plateform after 2015. The current usage metrics is available 48-96 hours after online publication and is updated daily on week days.
Initial download of the metrics may take a while.