Fig. 10.
Download original image
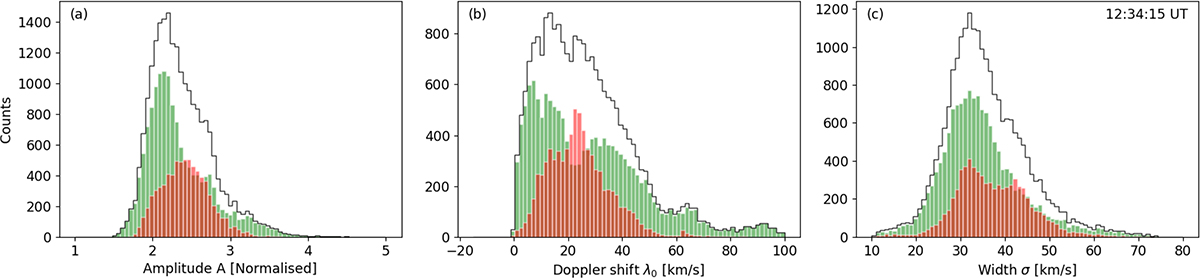
Distribution of the fitted parameters obtained from the F3 flare riblets at Δt = 3.4 min just before the GOES peak. This is the timestep with the highest number of pixels identified as riblets. The green bars show the distribution of fitting to a single Gaussian curve. The red bars represent the distribution of parameters obtained from the main emission component of the double-Gaussian fitted profiles. The black curve is the cumulative of the green and red bars.
Current usage metrics show cumulative count of Article Views (full-text article views including HTML views, PDF and ePub downloads, according to the available data) and Abstracts Views on Vision4Press platform.
Data correspond to usage on the plateform after 2015. The current usage metrics is available 48-96 hours after online publication and is updated daily on week days.
Initial download of the metrics may take a while.