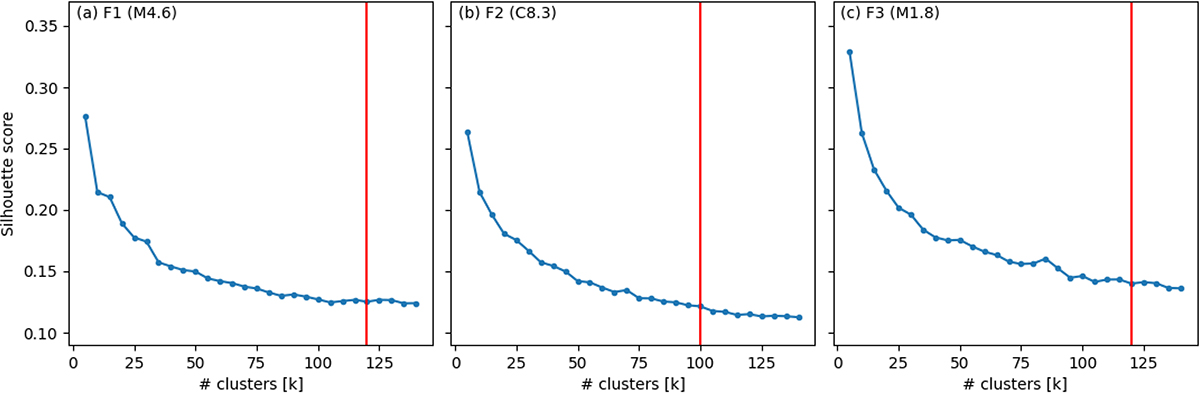
Fig. A.1.
Download original image
Silhouette score from the k-means algorithm. Each panel corresponds to the different flares with an increasing number of clusters, as denoted by the panel titles. For every iteration, a new subset of 25 000 random data points was used to compute the scores. The red vertical line in all panels denotes the number of clusters that were chosen for each dataset.
Current usage metrics show cumulative count of Article Views (full-text article views including HTML views, PDF and ePub downloads, according to the available data) and Abstracts Views on Vision4Press platform.
Data correspond to usage on the plateform after 2015. The current usage metrics is available 48-96 hours after online publication and is updated daily on week days.
Initial download of the metrics may take a while.