Fig. 3.
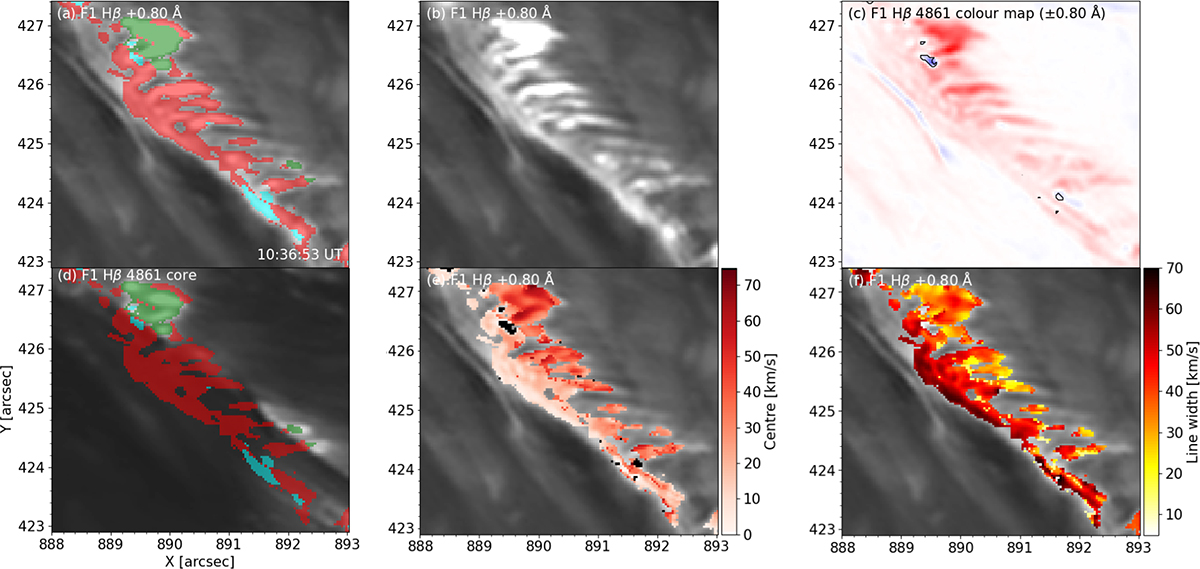
Download original image
Riblets along the F1 ribbon. All panels show the same FOV, highlighting the central parts of the eastern ribbon. All panels except panels c–d show images in the Hβ +0.8 Å channel. Panel c shows the wing-subtracted colour map at Hβ ± 0.8 Å. Panel a shows the ribbon with identified riblets overplotted in green, red, or cyan. Green pixels represent single-peaked RPs, red pixels represent double-peaked RPs with a stronger red peak, and cyan pixels represent near-symmetric double-peaked RPs. Similar is shown in panel d overplotted on the Hβ core image. The resulting Doppler shifts and profile widths obtained from fitting the pixels are shown in panels e–f, respectively. The black pixels in panel e mask the pixels where blue shifts were estimated. The contours of these pixels are added in panel c. An animation related to this figure is available online.
Current usage metrics show cumulative count of Article Views (full-text article views including HTML views, PDF and ePub downloads, according to the available data) and Abstracts Views on Vision4Press platform.
Data correspond to usage on the plateform after 2015. The current usage metrics is available 48-96 hours after online publication and is updated daily on week days.
Initial download of the metrics may take a while.